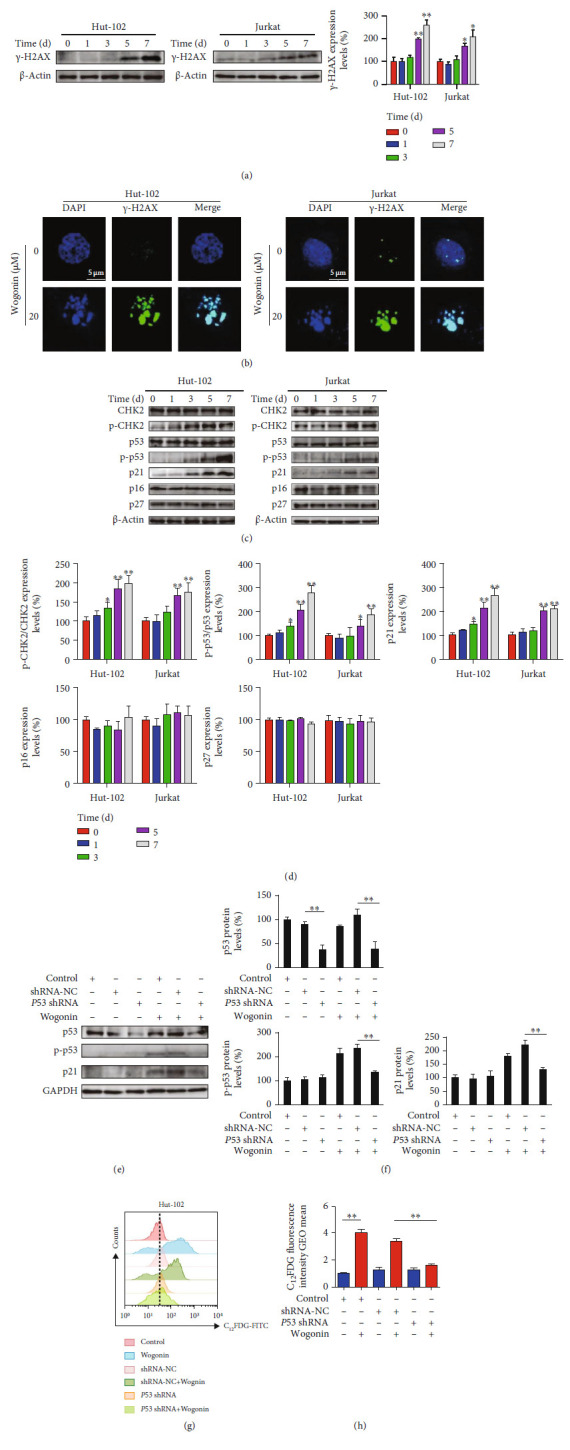
Figure 6.

Wogonin induced cellular senescence through p53-mediated DNA damage response. (a) Hut-102 and Jurkat cells were treated with or without 20 μM wogonin for the indicated time periods, and western blot was used to detect the expression change of the DNA damage marker protein γ-H2AX. β-Actin was used as loading controls. Relative protein expression level of γ-H2AX was determined. Columns represent the mean from three parallel experiments (mean ± SEM). ∗p < 0.05, ∗∗p < 0.01, compared with the control group. (b) Hut-102 and Jurkat cells were treated with or without 20 μM wogonin for 5 d; then, the cells were fixed, permeabilized, and stained with an antibody against γ-H2AX (green), while nuclei were stained with DAPI (blue). Immunofluorescent images showed the distribution of γ-H2AX in Hut-102 and Jurkat cells (original magnification ×1000; immersion objective ×100/×100 with immersion oil type). Images are representative of three independent experiments. (c) Hut-102 and Jurkat cells were treated with or without 20 μM wogonin for the indicated time periods (0, 1, 3, 5, and 7 d), and western blot was performed to detect the expression changes of CHK2, p-CHK2 (T68), p53, p-p53 (Ser15), p21, p16, and p27. β-Actin was used as loading controls. (d) Relative protein expression levels of p-CHK2/CHK2, p-p53/p53, p21, p16, and p27 were determined. Columns represent the mean from three parallel experiments (mean ± SEM). ∗p < 0.05, ∗∗p < 0.01, compared with the control group. (e) The protein expression levels of p53, p-p53 (Ser15), and p21 were detected by western blot. P53 shRNA-transfected Hut-102, shRNA-NC, and control Hut-102 cells were treated with or without 20 μM wogonin for 5 d. GAPDH was used as loading controls. (f) Relative protein expression levels of p53, p-p53 (Ser15), and p21. Columns represent the mean from three parallel experiments (mean ± SEM). ∗p < 0.05, ∗∗p < 0.01, compared with the control group. (g) Hut-102 cells were transfected with P53 shRNA and shRNA-NC by a lentiviral vector. P53 shRNA-transfected Hut-102, shRNA-NC, and control Hut-102 cells were treated with or without 20 μM wogonin for 5 d. The activity of SA-β-Gal was measured by flow cytometry (cells were stained with C12FDG). (h) Relative SA-β-Gal activity was assessed by using the GEOmean of groups, which represented C12FDG fluorescence intensity. Columns represent the mean from three parallel experiments (mean ± SEM). ∗p < 0.05, ∗∗p < 0.01, compared with the NC group.
