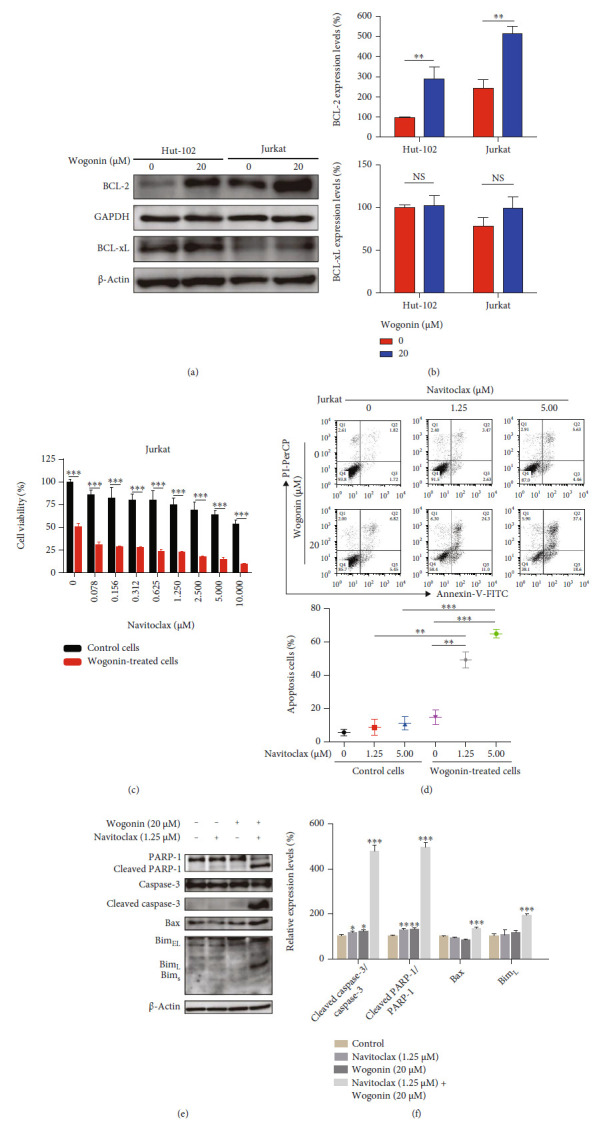
Figure 7.

Wogonin-induced cellular senescence sensitized Navitoclax to kill T-cell malignancy cells. (a) Hut-102 and Jurkat cells were treated with or without 20 μM wogonin for 5 d, and western blot was used to detect the expression change of BCL-2 and BCL-xL. GAPDH and β-actin were used as loading controls. (b) Relative protein expression levels of BCL-2 and BCL-xL. Columns represent the mean from three parallel experiments (mean ± SEM). ∗p < 0.05, ∗∗p < 0.01, compared with the control group. (c) Jurkat cells were exposed to 20 μM wogonin for 5 d, and then, control or wogonin-treated Jurkat cells were treated with the indicated concentrations of Navitoclax (0-10 μM) for 48 h. Cell viability was assayed by CCK8. The data represent the mean ± SEM of three different experiments. ∗∗∗p < 0.001, compared with the control group. (d) Jurkat cells were exposed to 20 μM wogonin for 5 d, and then, control or wogonin-treated Jurkat cells were then treated with the indicated concentrations of Navitoclax (1.25, 5 μM) for 48 h. Cell apoptosis was assayed by flow cytometry after Annexin-V/PI staining. Data represent the mean from three parallel experiments (mean ± SEM). ∗p < 0.05, ∗∗p < 0.01, and ∗∗∗p < 0.001, compared with the control group. (e) Jurkat cells were exposed to 20 μM wogonin for 5 d, and then, control or wogonin-treated Jurkat cells were then treated with the indicated concentrations of Navitoclax (1.25 μM) for 48 h. The protein expression levels of PARP-1, cleaved PARP-1, caspase-3, cleaved caspase-3, Bax, and Bim were analyzed by western blot. β-Actin were used as loading controls. (f) Relative protein expression levels of cleaved caspase-3/caspase-3, cleaved PARP-1/PARP-1, Bax, and BimL. Columns represent the mean from three parallel experiments (mean ± SEM). ∗p < 0.05, ∗∗p < 0.01, and ∗∗∗p < 0.001, compared with the control group.
