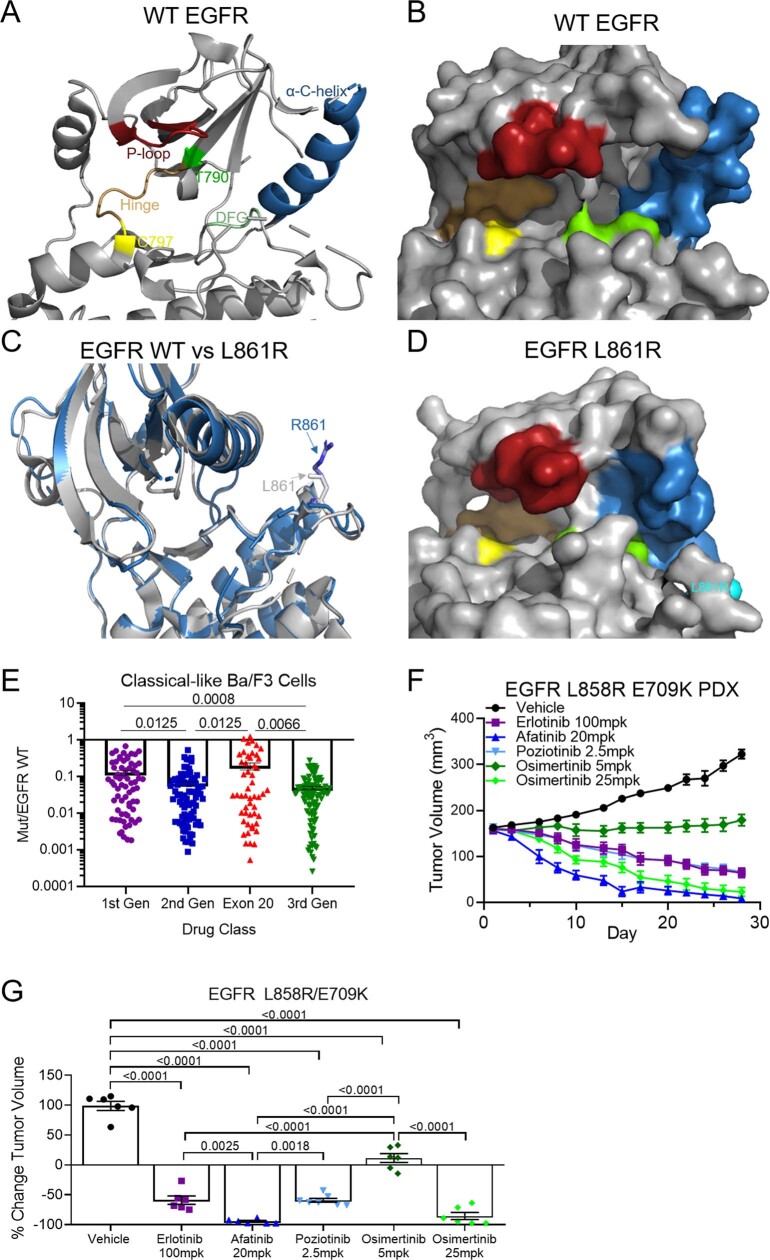
Extended Data Fig. 5. Classical-like EGFR mutations are not predicted to alter the drug-binding pocket and are most sensitive to 3rd-gen EGFR TKIs.
a, b, Rendering of crystal structure of WT EGFR (PDB 2ITX) visualized as both a ribbon (a) and space filling (b) models. Residues important in receptor signaling and drug binding are highlighted. c, d, Overlapped rendering of WT crystal (grey) (c) and L861R (blue) and space filing model (d) of L861Q demonstrate the R861 substitution is distal from the drug binding pocket and has minimal impact on the overall structure of EGFR compared to WT. e, Dot plot of mutant/WT IC50 values of Ba/F3 cells expressing classical-like EGFR mutations and treated with indicated classes of EGFR TKIs. Dots are representative of average of n=3 replicate mutant/WT IC50 values of individual cell lines expressing classical-like mutations with individual drugs. Bars are representative of average mutant/WT IC50 values ± SEM for each class of EGFR TKI and all classical-like cell lines. p-values were determined by one-way ANOVA with unequal SD as determined by Brown-Forsythe test to determine differences in SD. Holm-Sidak’s multiple comparisons test was used to determine differences between groups. f, Tumor growth curves for PDXs harboring EGFR L858R E709K complex mutation treated with indicated inhibitors. Tumors were measured three times per week and symbols are average of tumor volumes ± SEM. Mice were randomized into six groups: vehicle (N=6), poziotinib 2.5mg/kg (N=7), erlotinib 100mg/kg (N=6), afatinib 20mg/kg (N=6), osimertinib 5mg/kg (N=6), and osimertinib 25mg/kg (N=6). Mice received drug 5 days per week, and mice were euthanized at day 28 to harvest tumors. g, Dot plot of percent change in tumor volume on day 28 of tumors described in f. Dots are representative of each tumor, and bars are representative of average ± SEM for each group. Statistical differences were determined by ordinary one-way ANOVA with post-hoc Tukey’s multiple comparisons test to determined differences between groups vehicle, N=6 mice, poziotinib 2.5mg/kg, N=7 mice, erlotinib 100mg/kg, N=6 mice, afatinib 20mg/kg, N=6 mice, osimertinib 5mg/kg, N=6, and osimertinib 25mg/kg, N=6 mice.

