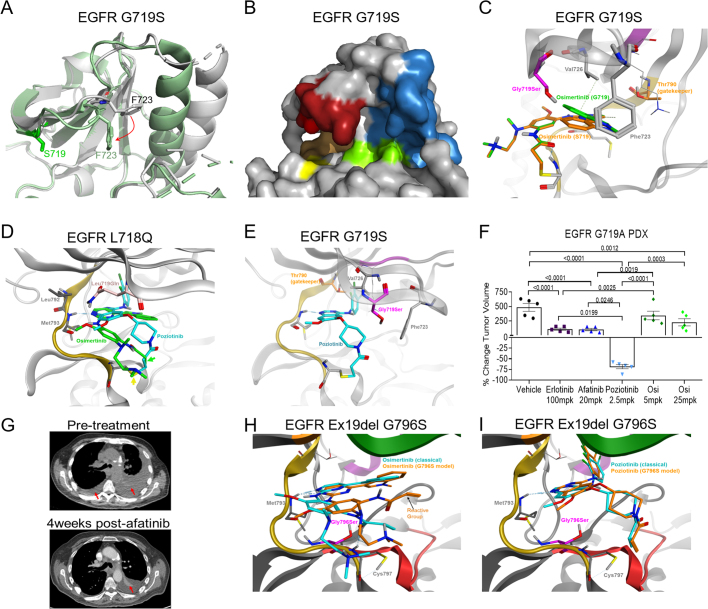
Extended Data Fig. 8. PACC mutations alter the orientation of the P-loop and/or αC-helix and are sensitive to 2nd-gen TKIs.
a, Overlap of G719S (PDB 2ITN, green) and WT EGFR (PDB 2ITX, grey) crystal structures demonstrate arobust shift of F723 (red arrow) in the P-loop orienting the benzyl ring in a downward position condensing the P-loop in the drug binding pocket. Further, G719S displays an inward shift of the αC-helix compared to the WT crystal structure. b, Surface representation of G719S (PDB 2ITN) with P-loop (red), αC-helix (blue), hinge region (orange), C797 (yellow), and DFG motif (green) highlighted to demonstrate steric hindrance of drug binding pocket caused by shifted P-loop. c, Comparison of osimertinib bound to wild-type EGFR (PDB 4ZAU, green) or EGFR G719S (PDB 2ITN, purple) demonstrates destabilization of TKI-protein interactions. d, In silico homology model of EGFR L718Q (pink) with predicted binding modes of osimertinib and poziotinib structures demonstrates that Q718 hinders the interaction of osimertinib (green) with M793 and shifts the Michael acceptor (reactive group, green arrow) out of alignment with C797 (yellow arrow). In contrast, poziotinib (blue) is less effected by Q718 and is still positioned to react with C797, even in the context of L718Q mutations. e, In silico modeling of EGFR G719S (purple) with poziotinib (blue) shows no predicted changes in poziotinib binding or TKI-protein interactions. f, Dot plot of percent change in tumor volume on day 28 of tumors described in Fig. 3c. Dots are representative of each tumor, and bars are representative of average ± SEM for each group, N=5 mice per treatment group. Statistical differences were determined by ordinary one-way ANOVA with post-hoc Tukey’s multiple comparisons test to determined differences between groups. g, Representative CT images from a patient harbouring E709K G719S complex mutation before and after four weeks of afatinib treatment. Red arrow indicates resolved pleural effusion on the left lobe and reduced pleural effusion and tumor in the right lobe. h, In silico modeling of EGFR Ex19del G796S (purple) with osimertinib in the reactive (blue) and predicted (orange) conformations demonstrate destabilization of TKI-protein interactions in the hinge region (yellow), displacing the reactive group (arrow). i, In silico modeling of EGFR Ex19del G796S (purple) with the reactive conformation of poziotinib (blue) and the predicted conformation of poziotinib (orange) predicted minimal changes in poziotinib binding and similar TKI-protein interactions.

