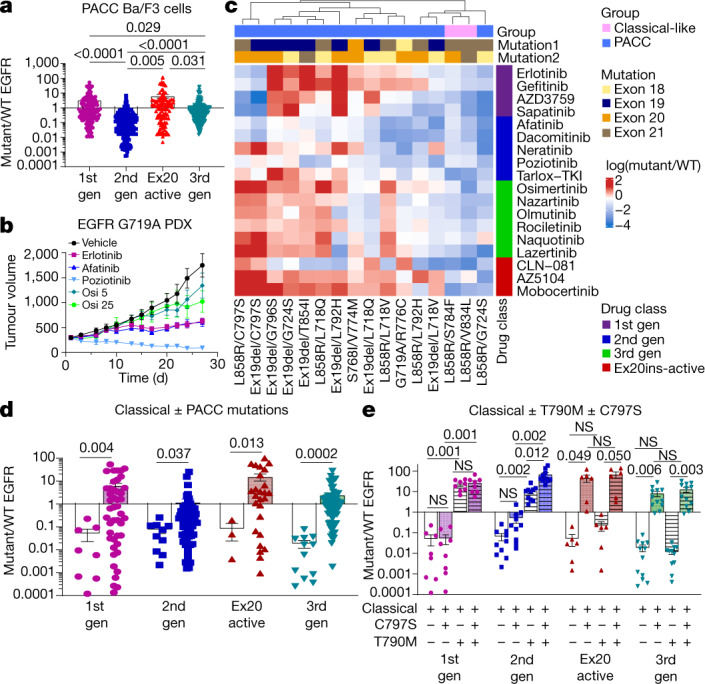
Fig. 3. PACC mutations are robustly sensitive to second-gneeration TKIs.

a, Dot plot of mutant/WT IC50 values of Ba/F3 cells expressing PACC mutations. b, Tumour growth curves for PDXs containing EGFR G719A PACC mutation treated with TKIs five days per week. Symbols show mean tumour volume ± s.e.m., n = 5 mice. Osi 5, osimertinib 5 mg kg−1; osi 25, osimertinib 25 mg kg−1. c, Heat map with unsupervised hierarchical clustering of log(mutant/WT) ratios from Ba/F3 cells expressing indicated mutations after drug treatment. Squares represent the median of n = 3 replicates. Mutation order was assigned arbitrarily; groups were assigned on the basis of predicted mutational impact. d, Dot plot of mutant/WT IC50 values of Ba/F3 cells expressing classical EGFR mutations (white bars) with or without PACC mutations (coloured bars). In a, d, P values were determined by one-way analysis of variance (ANOVA) with unequal s.d. and Holm–Sidak’s multiple comparisons test. e, Average mutant/WT ratio of Ba/F3 cells expressing classical EGFR mutations (white bars), and classical EGFR mutations plus C797S (shaded bar), T790M (hashed bars) or T790M and C797S (shaded and hashed bars). P values were determined by one-way ANOVA with repeated measures and post hoc Fishers’ multiple comparisons test. In a, f, h, bars show mean ± s.e.m. of mutant/WT ratio for all mutations and drugs; dots show representative average mutant/WT of n = 3 replicates.
