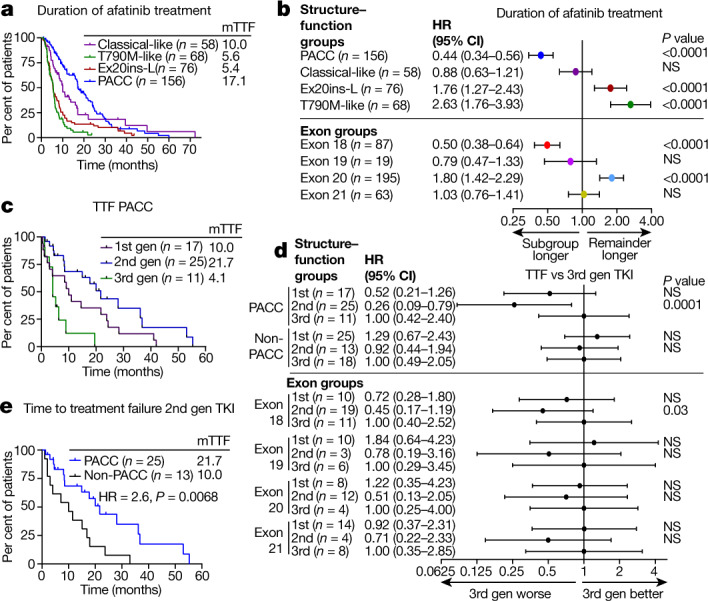
Fig. 4. Structure–function groups better predict patient outcomes than exon-based groups.

a, Kaplan–Meier plot of DOT of patients with NSCLC tumours containing atypical EGFR mutations (n = 358 patients) stratified by structure-based groups treated with afatinib. b, Forest plot of HRs calculated from Kaplan–Meier plots in a and Extended Data Fig. 10c. In a, b, classical-like, n = 58; T790M-like, n = 68; Ex20ins-L, n = 76; PACC, n = 156; exon 18, n = 87; exon 19, n = 19; exon 20, n = 195; exon 21, n = 63. c, Kaplan–Meier plot of TTF of patients with PACC mutations treated with first-, second- or third-generation EGFR TKIs. d, Forest plot of HRs calculated from Kaplan–Meier plots in c and Extended Data Fig. 10d–h. In c, d, PACC, n = 53; non-PACC, n = 56; exon 18, n = 40; exon 19, n = 19; exon 20, n = 24; exon 21, n = 26. e, Kaplan–Meier plot of TTF of patients with PACC mutations (n = 25) or non-PACC mutations (n = 13) treated with second-generation TKIs. In a–e, HRs and P values were calculated using two-sided Mantel–Cox log-rank tests. In b, d, data are representative of HR ± 95% confidence interval.
