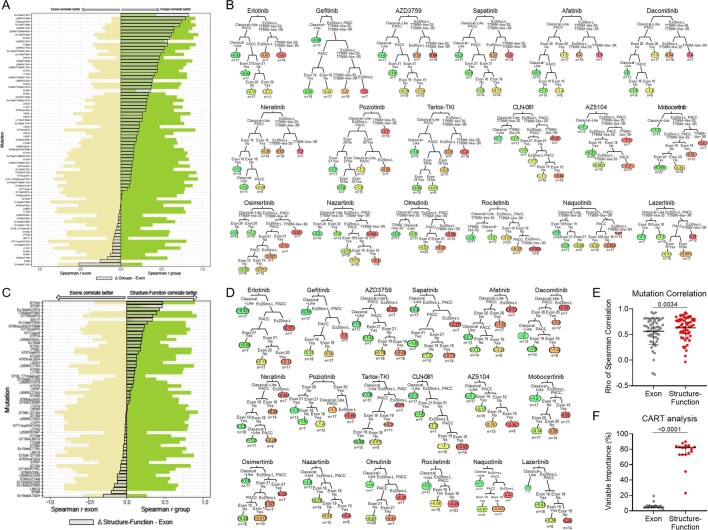
Extended Data Fig. 4. Structure-function-based groupings are more predictive of drug and mutation sensitivity compared to exon-based groupings.
a, Bar plot of Spearman rho values for indicated mutations compared to exon-based groups (yellow) or structure-function-based groups (green). The delta of the two rho values is shown as an overlapped grey bar. When the delta bar shifts to the right, the spearman rho value was higher for structure-function-based groups, and when the grey bar shifts to the left, the spearman rho value was higher for the exon-based groups. b, Representative classification and regression trees for each indicated drug. Colors represent drug sensitivity (green) or resistance (red) as defined by log (mutant IC50/WT EGFR IC50). c, Bar plot of Spearman rho values for indicated mutations (excluding T790M mutations) compared to exon-based groups (yellow) or structure-function-based groups (green). The delta of the two rho values is shown as an overlapped grey bar. d, Representative classification and regression trees for each indicated drug excluding T790M from the analysis. Colors represent drug sensitivity (green) or resistance (red) as defined by log (mutant IC50/WT EGFR IC50). e, Dot plot of rho values from Spearman correlations of mutations vs exon-based group averages or structure-function based averages for each drug excluding T790M mutations. Dots are representative of each mutation; bars are representative of the average rho value ± standard deviation (SD). p-value was determined using a paired two-sided t-test, and n = 59 cell lines/mutations. f, Dot plot of variable importance calculated as sum of the goodness of split for each split in the classification and regression trees (CART). Dots are representative of variable importance for each drug in the exon and structure-function-based groups as indicated and excluding T790M mutations. Bars are representative of the median + 95% confidence interval of variable importance for all drugs (Supplementary Table 3). p-value was determined using a paired two-sided t-test, and n = 18 drugs

