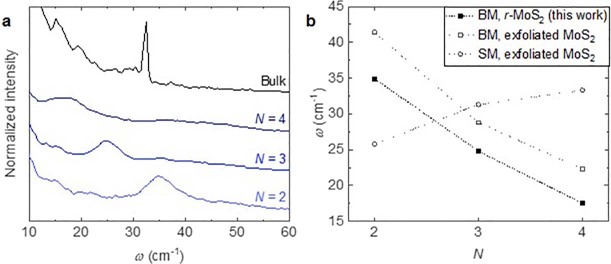
Extended Data Fig. 4. Low-frequency Raman modes of r-MoS2.
a, Raman spectra reflecting the breathing modes (BM) of r-MoS2 (blue) and the shear mode (SM) for MoS2. b, The low-frequency Raman peak positions of r-MoS2 and exfoliated MoS2. The filled squares indicate the BM peak positions of r-MoS2. The open squares indicate the BM peak positions of exfoliated MoS2, and the open circles indicate the SM peak positions of exfoliated MoS272.

