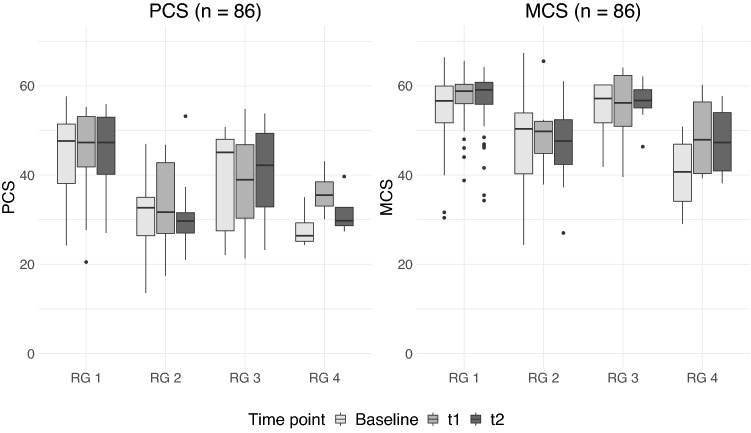
Fig. 2.
Changes in PCS and MCS scores between risk groups and over time. RG 1 = participants free of clinically relevant mental disorders, RG 2 = participants with depression, RG 3 = participants with MCI, RG 4 = participants with depression and MCI. Scores in the boxplot had not yet been adjusted for other variables (e.g. gender) and considered only those study participants who had complete measurements over all three measurement times

