
Fig. 1.
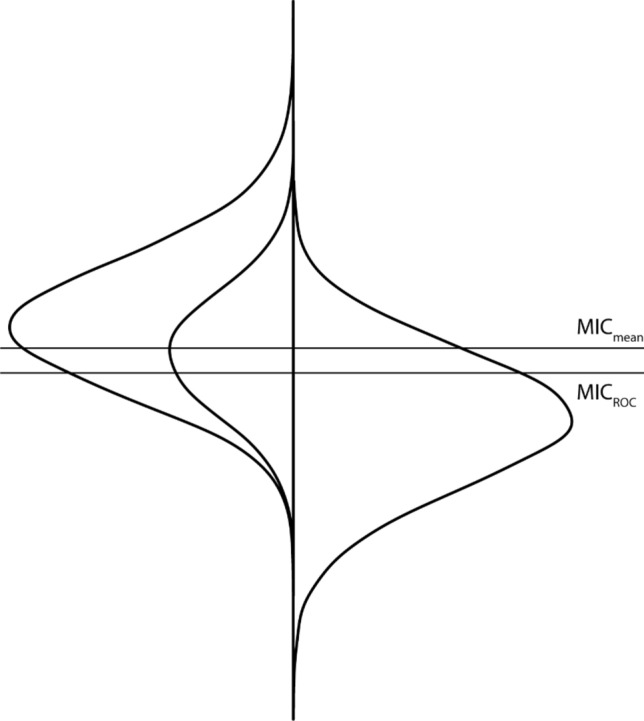
MICmean and MICROC. On the left, the distribution of change scores in all patients who are ‘improved’ (larger distribution) and in patients who are ‘a little better’ (smaller distribution), on the right the distribution of change scores in patients who are ‘not improved’. The upper line represents the MICmean (based on the smaller distribution on the left side), the lower line represents the MICROC (based on the larger left-sided distribution and the right-sided distribution)