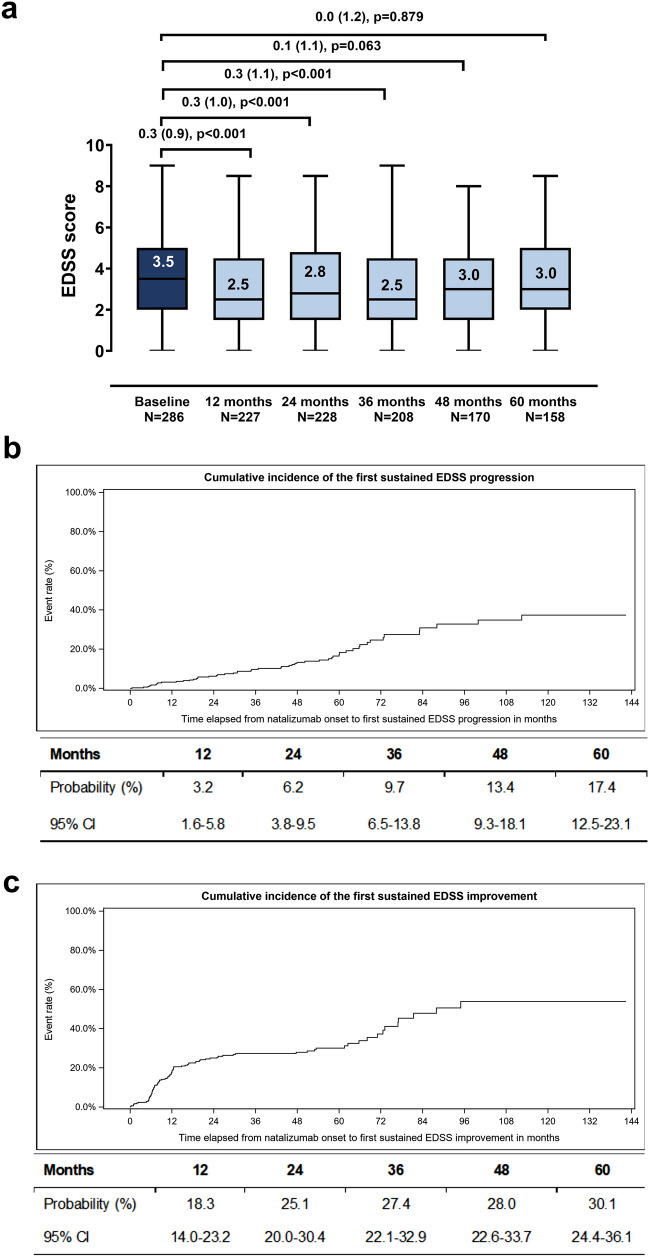
Fig. 1.
EDSS disability progression during study participation. Box-plots of the EDSS score at baseline and at the post-baseline timepoints (a). Numbers indicate median values; boxes extend from first to third quartile and whiskers from minimum to maximum score. Mean (SD) decrease from baseline derived from paired data along with p values (Wilcoxon signed-rank test) are indicated; median decreases were not shown as they were all zero. Kaplan-Meier estimated cumulative probability of 6-month sustained EDSS progression (b). Estimated cumulative probabilities at the 12-, 24-, 36-, 48-, and 60-month timepoints are tabulated below the graph. Kaplan-Meier estimated cumulative probability of 6-month sustained EDSS improvement (c). Estimated cumulative probabilities at the 12-, 24-, 36-, 48-, and 60-month timepoints are tabulated below the graph. Analyses in b and c was performed among eligible patients with a baseline and at least one post-baseline EDSS assessment (N = 286). EDSS expanded disability status scale, CI confidence interval, N number of patients with available data

