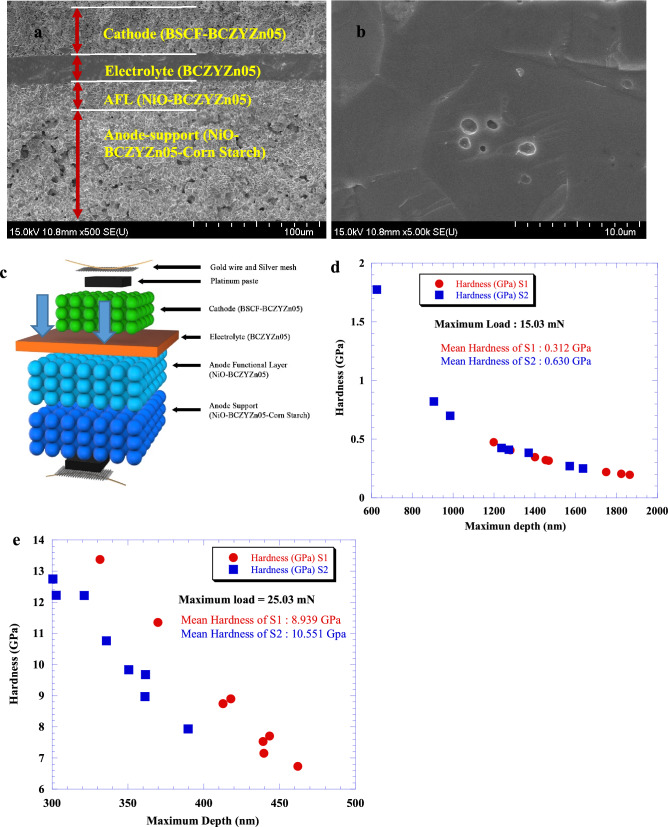
Figure 2.
SEM analysis and hardness test. (a) Cross-sectional image of the single cell indicating the porosity difference in the anode and cathode and electrolyte. The electrolyte is the densest part of the cell and is approximately 26 μm thick. (b) Cross-section of the electrolyte to observe the grain size and boundaries. (c) Schematic diagram of nanoindentation on the cathode and electrolyte surface. Due to the higher density, the electrolyte is the hardest part of the cell. (d) Comparison of the hardness of the cathode between two cells without mixing BCZYZn05 with BSCF (S1) and with mixing BCZYZn05 (40%) with. BSCF (60%) (S2). (e) Comparison of hardness between two electrolytes: Ba0.9Sr0.1Ce0.5Zr0.35Y0.1Sm0.05O3−δ40 (S1) and BCZYZn05 (S2).

