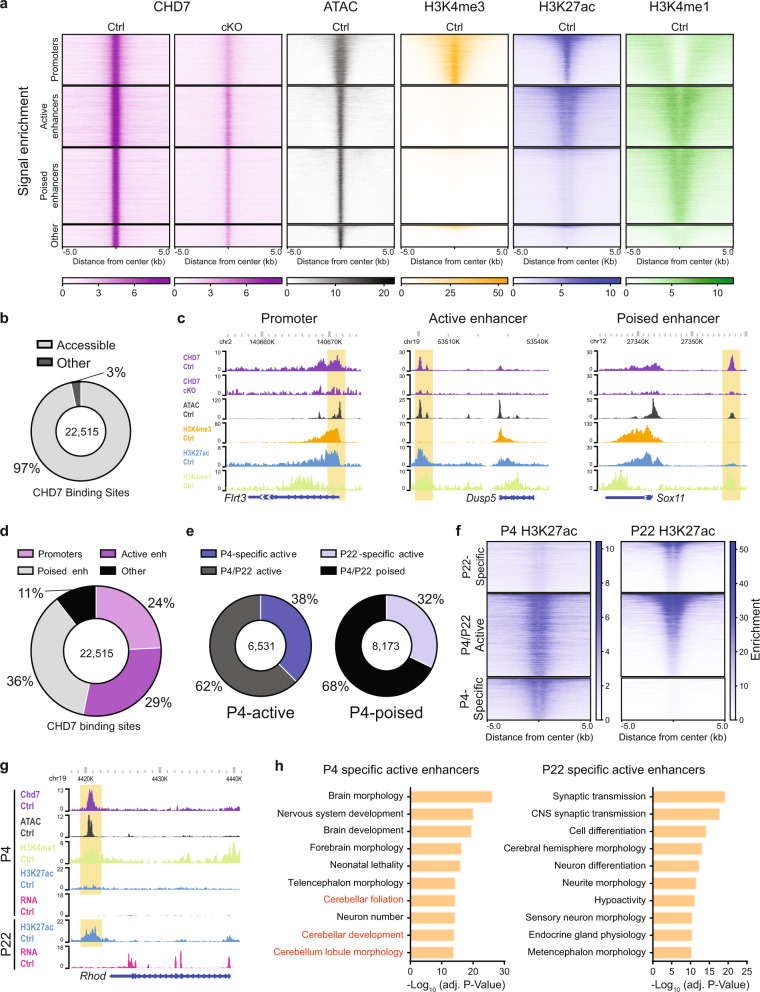
Fig. 1. CHD7 occupies accessible enhancers characterized by temporally distinct activity states.
a Heatmap of ChIP-seq signal for CHD7 (purple), H3K4me3 (orange), H3K27ac (blue), H3K4me1 (green) and ATAC-seq (black) centered on CHD7 genomic binding sites (n = 22,515). Heatmaps are split into four groups (promoters, active enhancers, poised enhancers, and other). Anterior cerebellum from P4 mice were used (n = 2 for CHD7 Ctrl, n = 1 for CHD7 cKO, n = 3 for histone modifications and ATAC-seq). b Pie chart depicting the proportion of CHD7-binding sites found to overlap ATAC-seq peaks (accessible regions) and not overlap (other). c WashU Epigenome Browser view of a promoter (left), active enhancer (middle), and poised enhancer (right) region (highlighted). Each site shows ChIP-seq coverage of CHD7, H3K4me3, H3K27ac, H3K4me1, and ATAC-seq. d Pie chart displaying regulatory element distribution of CHD7 peaks. Enh, enhancer. e Pie charts displaying the distribution of CHD7-bound P4-active (left) and P4-poised (right) enhancers at P4 (n = 3) and P22 (n = 3). f Heatmap of P4 and P22 H3K27ac ChIP-seq (n = 3 for each timepoint) centered on CHD7 developmentally active enhancer binding sites (n = 14,704). Heatmaps are split into three groups (P4-specific, P4/P22-active, and P4specific). g WashU Epigenome Browser view of a CHD7-bound P4 poised, P22-active enhancer (highlighted). ChIP-seq coverage for CHD7, H3K27ac, H3K4me1, as well as, ATAC-seq and RNA-seq is shown. h GREAT analysis showing enriched mouse phenotypes associated with P4-specific active enhancers (left) and P22-specific active enhancers (right).

