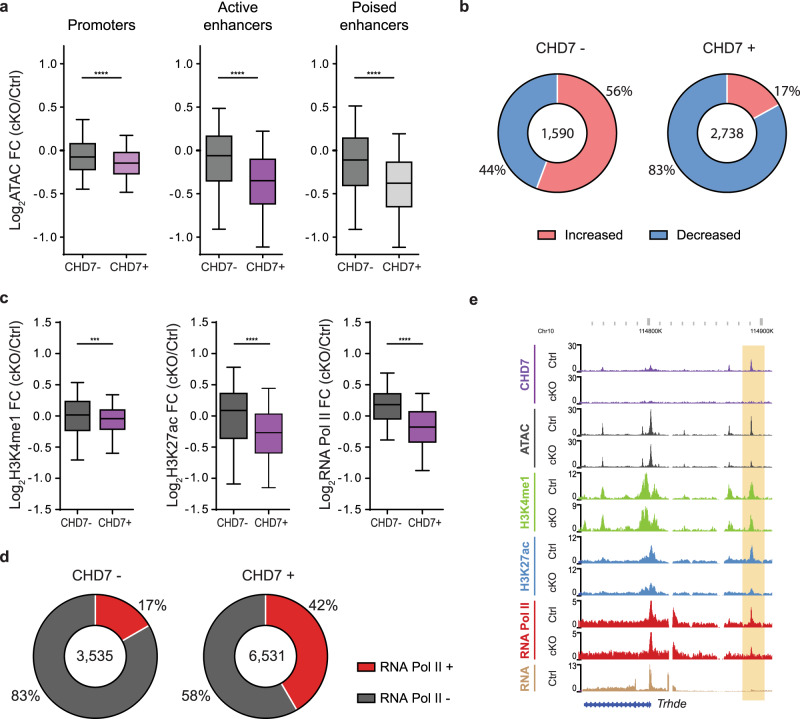
Fig. 2. CHD7 regulates chromatin accessibility and activity state at enhancers.
a Box-whisker plots showing the median, 1st quartile, 3rd quartile, and whiskers displaying the 5th and 95th percentiles of promoters (n = 11,398, n = 5238), active enhancers (n = 3535, n = 6531), and poised enhancers (n = 25,231, n = 8039) representing median and distribution of the log2 fold-change of ATAC-seq signal in CHD7 cKO over CHD7 control. CHD7 unoccupied, (CHD7–) left, and occupied, (CHD7+) right, enhancers are shown. ****p < 10−4, unpaired two-sided t-test, Welch’s correction. b Pie chart representing proportion active enhancers that show significantly changed accessibility in the CHD7 cKO, which display either increased or reduced accessibility. c Box-whisker plots showing the median, 1st quartile, 3rd quartile, and whiskers displaying the 5th and 95th percentiles of active enhancers representing median and distribution of the log2 fold-change of H3K4me1 (left; n = 760, n = 2457), H3K27ac (middle; n = 1590, n = 2738), and RNApolII (right; n = 249, n = 1099) signal in CHD7 cKO over CHD7 control. ***p < 10–3, ****p < 10− 4, unpaired two-sided t-test, Welch’s correction. d Pie chart representing proportion of CHD7 unoccupied (CHD7−; left) and occupied (CHD7+; right) active enhancers displaying RNApolII binding. e WashU Epigenome Browser view of a CHD7-bound active enhancer (highlighted) near the Trhde gene. ChIP-seq coverage for CHD7, H3K27ac, H3K4me1, RNApolII, as well as ATAC-seq and RNA-seq is shown.

