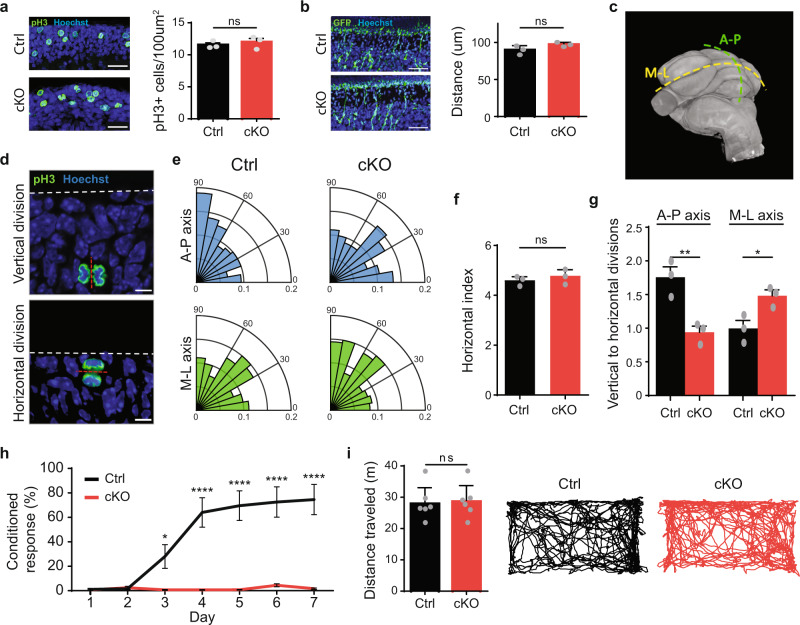
Fig. 5. CHD7 regulates the preferred axis of division for GCPs.
a Immunohistochemistry analysis of Ctrl and cKO mice (n = 3 for each condition) with antibodies recognizing phosphorylated histone H3 (pH3), a marker of dividing cells. Dividing cells were counted in the entirety of the region anterior to the primary fissure of the cerebellum (lobules I–V), referred to in shorthand as the anterior cerebellum. A representative image of the external granule layer is shown (left). Bar graphs (right) show mean pH3 positive cells per 100 µm2 ± s.e.m. ns = non-significant. Paired two-sided t-test. Scale bar: 25 µm. b P6 mouse pups were electroporated (n = 3 for each condition) with the GFP expression plasmid and killed 48 h later. Cerebella were removed, sectioned, and subjected to immunohistochemistry with antibodies recognizing GFP. Bar graphs show mean distance from EGL ± s.e.m. ns = non-significant. Paired two-sided t-test. Scale bar: 25 µm. c Image of P56 cerebellum obtained via nano CT scan (left) showing anterior–posterior axis (A–P) in green and medial–lateral axis (M–L) in yellow. d Immunohistochemistry analysis of axis of division of granule cell precursors, identified via pH3 staining in green. Dashed red line indicates the plane of division; dashed white line indicates the pial surface. Example of a granule cell precursor undergoing a vertical (top) and horizontal (bottom) division. Experiment was repeated three times for each condition. Scale bar: 5 µm. e Rose plot showing the distribution of axis of division angles (angle between pial surface and plane of division) for P3 Ctrl and cKO mice in A–P (top, blue) and M–L (bottom, green) axes. 180 cells (60 from each mouse, n = 3 for each condition) were analyzed for each rose plot. f Bar graph showing mean number of horizontal division per 100 µm2 ± s.e.m. (n = 3 for each condition). ns = non-significant. Paired two-sided t-test. g Bar graph showing mean ratio of vertical to horizontal division ± s.e.m. for Ctrl and cKO mice in both A–P and M–L axes (n = 3 for each condition). *p = 0.0068 (AP), p = 0.0256 (ML) Paired two-sided t-test. h Cerebellar-dependent eye-blink conditioning learning paradigm was performed on CHD7 Ctrl and cKO (n = 7 and n = 9, respectively) mice. Percent conditioned response (CR) is shown as mean ± SEM for each session day. ∗∗∗∗p < 10− 4, ∗p < 0.05 two-sided repeated-measures ANOVA, Sidak’s multiple comparison test. i Open-field assay was performed on CHD7 Ctrl and cKO mice (n = 6 for each) to assess general locomotor activity. Two-sided t-test; ns, not significant.

