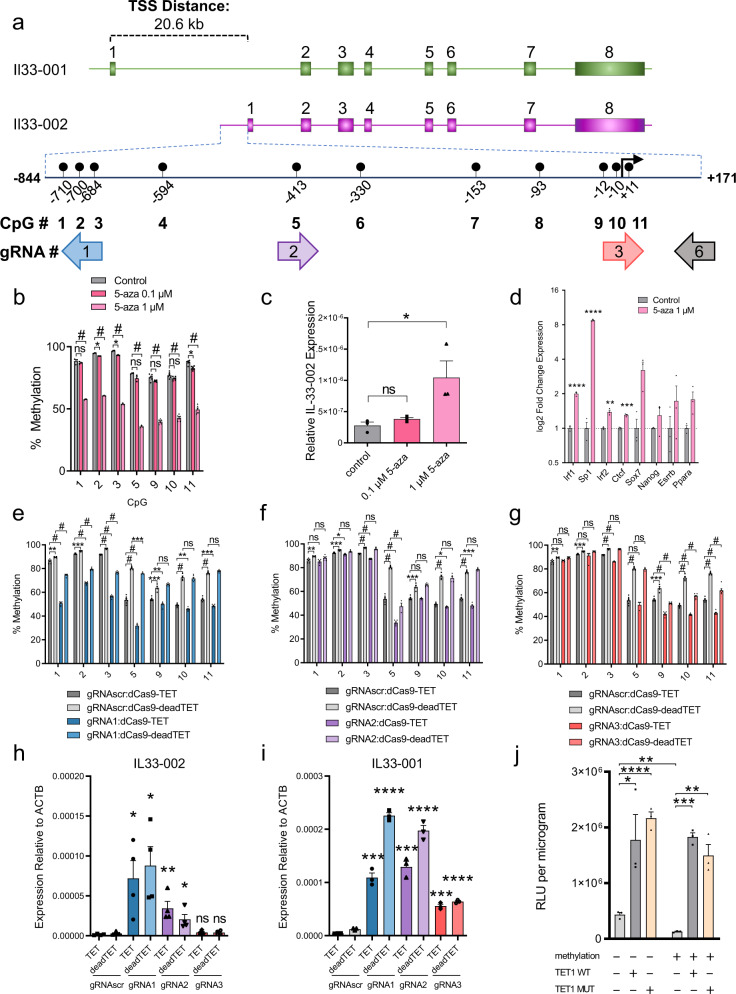
Fig. 1. Targeting the Il33 promoter with dCas9-TET.
a Schematic of the murine Il33 genomic locus depicting the two transcriptional isoforms with a highlighted 800 bp region of the Il33-002 promoter and the locations of the 11 CpGs as well as four gRNAs targeting specific CpGs. The 11 CpGs are numbered sequentially in the 5′ to 3′ direction. The promoter-targeting gRNAs used in these experiments are shown relative to the CpGs and are approximately to scale such that CpGs 1, 2, and 3 are targeted by gRNA1, CpG 5 by gRNA 2, and gRNA 3 targets CpGs 9, 10, and 11—which overlap the transcription start site (TSS), marked by a black arrow. The orientation of the gRNAs is indicated by the direction of the arrow labeled with the respective gRNA, where an arrow pointing to the left indicates a gRNA that binds the plus strand. The fragment cloned into the luciferase vector (pCpGl) is marked at either end, spanning from −844 to +171 relative to the TSS. b Percent of DNA methylation (mean ± SEM) assayed by bisulfite-pyrosequencing at the three TSS CpGs (labeled 9–11) following treatment of NIH-3T3 cells with indicated concentrations of 5-aza-2′-deoxycytidine (5-aza) or water control (n = 3 independent experiments for CpGs 1, 2, 3, and 5; n = 6 for CpGs 9, 10, and 11). c Expression of Il33-002 (mean ± SEM) quantified by RT-qPCR and normalized to beta actin (Actb) expression following treatment of NIH-3T3 cells with indicated concentrations of 5-aza-2′-deoxycytidine (5-aza) or water control (n = 3 biologically independent samples) (Student’s t-test, two sided, control vs. 0.1 µM 5-aza; P = 0.1636, control vs. 1 µM 5-aza; P = 0.0482). d Expression (mean ± SEM) of predicted (Transfac) and experimentally validated (Qiagen, ENCODE, Gene Transcription Regulation Database) Il33-002 transcription factors quantified by RT-qPCR and normalized to Actb expression following treatment of NIH-3T3 cells with indicated concentrations of 5-aza-2′-deoxycytidine (5-aza) or water control (n = 3 biologically independent samples). e–g Percent of DNA methylation (mean ± SEM) assayed by bisulfite-pyrosequencing at seven targeted CpGs in the Il33-002 promoter following transduction with lentiviruses and antibiotic selection of virally infected cells (gRNAs) or selection by flow cytometry (BFP; dCas9 constructs) of NIH-3T3 cells with dCas9-Tet/dCas9-deadTET (BFP) and gRNA1 (e), gRNA2 (f), or gRNA3 (g) compared to gRNAscr (light and dark gray, gRNAscr data identical in e–g and shown for comparison) (n = 4–8 biologically independent experiments, depending on specific condition and CpG; see Source Data file for specific n of interest). h, i Expression of Il33-002 (h) and Il33-001 (i) (mean ± SEM) quantified by RT-qPCR and normalized to Actb expression in NIH-3T3 stably expressing one of 4 gRNAs and dCas9-TET or dCas9-deadTET (n = 3–4 biologically independent samples; statistical comparisons are between each gRNA and gRNAscr bearing the same dCas9 construct (dCas9-TET or dCas9-deadTET)). All data shown as (mean± SEM). j Relative light units normalized to protein quantity (mean ± SEM) in transfected HEK293 cells. Cells were transiently transfected with methylated or unmethylated SV40-luciferase vector along with mammalian wild-type or mutant human TET1 expression plasmid or empty vector (pEF1A) control (n = 3). * indicates statistically significant difference of P < 0.05, **P < 0.01, ***P < 0.001, **** or # of P < 0.0001, and ns not significant (Student’s t-test, two-sided, with Holm-Sidak correction if number of tests is greater than 3). Source data are provided as a Source Data file.

