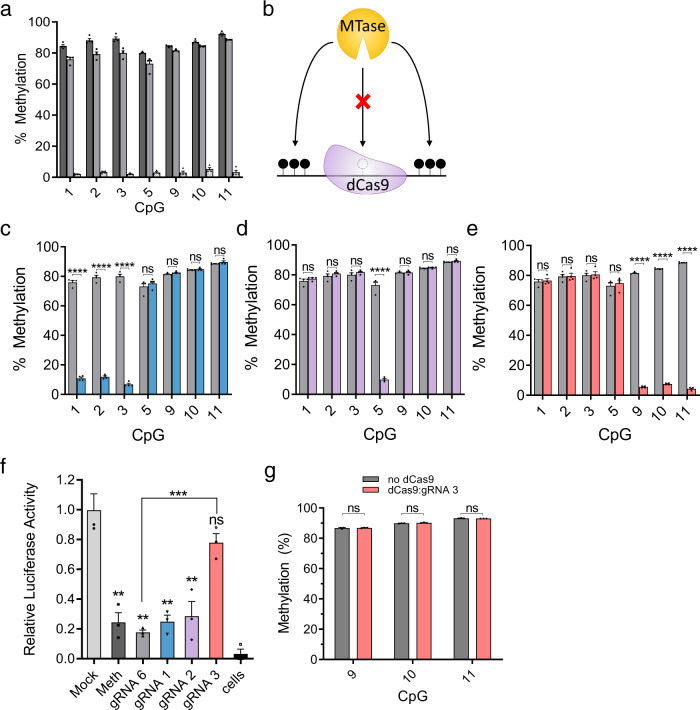
Fig. 2. dCas9 blocks DNA methyltransferase in vitro.
a Pyrosequencing data (mean ± SEM, n = 4 biologically independent samples) for the methylation state of indicated CpGs in the Il33-pCpGl plasmid following standard methylation for 4 h by M.SssI (dark gray), methylation in the presence of dCas9 and gRNA 6 (distant binding) (gray), or a mock-methylated control reaction that lacked S-adenosyl methionine substrate (light gray). b Diagram illustrating the principle of site-specific methylation utilizing pre-incubation of DNA with dCas9 and selective CpG-targeting guide restricting M.SssI from binding and methylating the targeted region, while permitting methylation of remaining unobstructed CpGs. c–e Pyrosequencing data (n = 4 biologically independent samples, mean ± SEM)) for the methylation state of CpGs in the IL-33-pCpGl plasmid following pre-incubation with dCas9 and gRNA1 (c), gRNA2 (d), or gRNA3 (e) and methylation by M.SssI (colored bars). Gray bars are identical (a, c–e) and indicate methylation levels for the same treatment utilizing gRNA6. f Luciferase reporter activity of the plasmids (a, c–e), expressed as relative light units (mean ± SEM) normalized for protein content per sample, and then normalized to average value for mock methylated condition (n = 3 biologically independent experiments). All statistical comparisons are to mock methylated conditions unless otherwise indicated. g Percent of methylation (mean ± SEM) assayed by pyrosequencing when Il33-pCpGl is incubated with dCas9 and gRNA 3 or only gRNA 3 (no dCas9 control) after standard methylation, instead of before (n = 3 biologically independent samples). * indicates statistically significant difference of P < 0.05, **P < 0.01, ***P < 0.001, ****P < 0.0001, and ns not significant (Student’s t-test, two-sided, with Holm-Sidak correction if number of tests is greater than 3). Source data are provided as a Source Data file.

