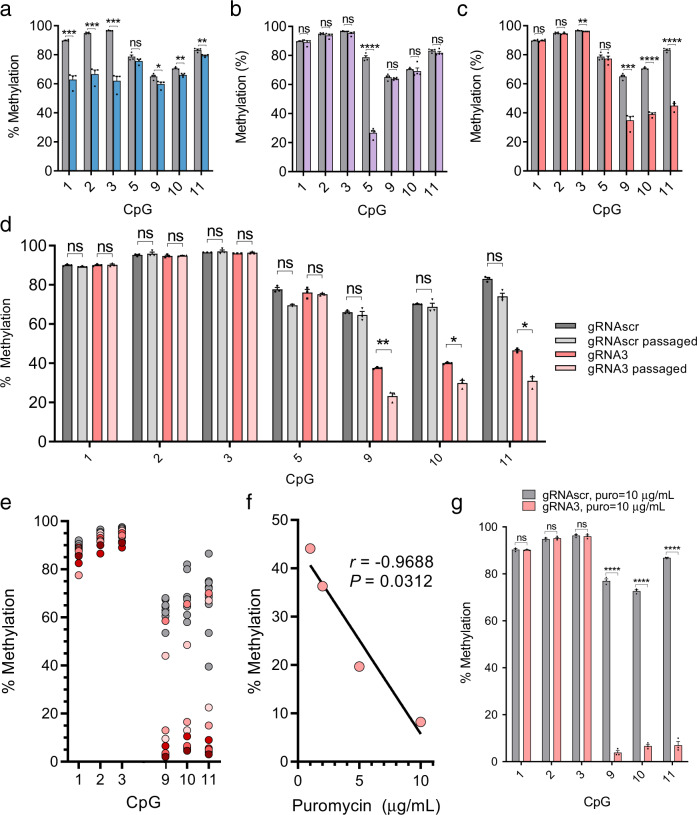
Fig. 4. dCas9 causes demethylation in mammalian cells.
a–c Methylation levels (mean ± SEM) assayed by bisulfite-pyrosequencing at CpGs 1, 2, 3, 5, 9, 10, and 11 of the Il33-002 promoter in NIH-3T3 cells stably expressing dCas9 and gRNA1 (a blue), gRNA2 (b purple), gRNA3 (c pink) or scrambled gRNA (a–c, gray; identical in all) (n = 4 biologically independent samples). d Cells from c were passaged for an additional 30 days and methylation percentage was assayed as previously (n = 3 biologically independent samples, mean ± SEM). e Cells from c were subjected to clonal isolation and expansion. Gray circles represent methylation levels of clones containing dCas9 and scrambled gRNA and various red circles represent methylation levels of randomly selected clones stably expressing dCas9 and gRNA 3 (n = 10 independent clones per condition). f Average DNA methylation at CpGs 9–11, assayed by bisulfite-pyrosequencing, as a function of increasing the selection antibiotic puromycin (lentivirus is expressing puromycin resistance gene) concentration in cell lines (pools) stably expressing dCas9 and gRNA3 (n = 1 cell line per puromycin concentration) fitted with a line of best fit. g DNA methylation at CpGs 1, 2, 3, 9, 10, and 11 in (n = 3 biologically independent samples, mean ± SEM) NIH-3T3 cells stably expressing dCas9 and gRNA3 (pink) or control gRNAscr (gray) and treated with 10 µg/mL puromycin until no antibiotic-associated cell death could be observed and surviving cells were of sufficient quantity for DNA extraction and other procedures (approximately 2 weeks). * indicates statistically significant difference of P < 0.05, **P < 0.01, ***P < 0.001, ****P < 0.0001, and ns not significant (Student’s t-test, two-sided, with Holm-Sidak correction if number of tests is greater than 3). Source data are provided as a Source Data file.

