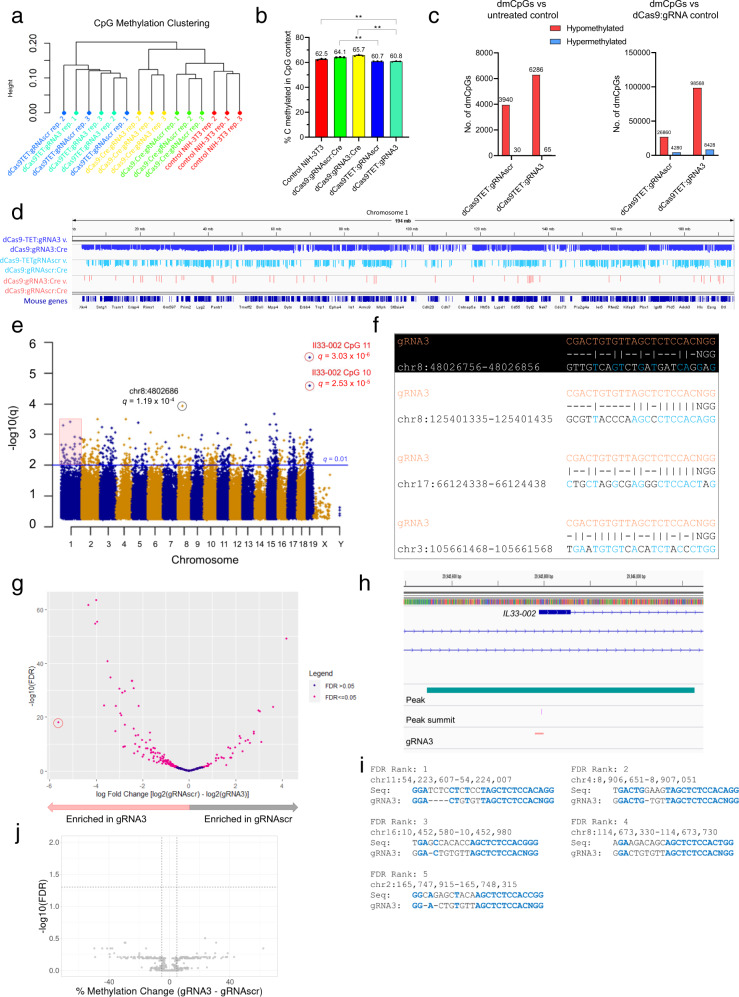
Fig. 6. WGBS and ChIP-seq analyses of dCas9 and dCas9-TET approaches to targeted demethylation.
a Clustering of NIH-3T3 samples with indicated lentiviral treatment and replicate number by CpG methylation, based on highly covered (≥10×) CpGs common to all samples with the cluster using Samples function in the methylKit package for R (ward.D2 method). b Fraction of total sequenced CpGs (mean ± SEM) that read as methylated (after bisulfite conversion) in each treatment type, aligned and calculated with Bismark default parameters (n = 3, biological replicates; **P < 0.01 with two-sided Student’s t-test). c Number of significantly differentially methylated CpGs (dmCpGs) (red = hypomethylated, blue = hypermethylated) determined by methylKit calculateDiffMeth function (≥5× coverage, n = 3, q-value (p-value adjusted for multiple testing by SLIM method) <0.01, 25% methylation difference) of dCas9TET:gRNAscr and dCas9TET:gRNA3 NIH-3T3 cell lines compared to untreated control NIH-3T3 cells (left) or compared to dCas9:gRNAscr:Cre or dCas9:gRNA3:Cre, respectively. d Genome browser view of mouse (mm10 genome) chromosome 1, with bedGraphs containing hypomethylated dmCpGs (and amount of hypomethylation in %) in dCas9-TET:gRNA3 (top, blue) and dCas9-TET:gRNAscr (middle, light blue) from (c, right, chromosome 1 only) and dCas9:gRNA3:Cre hypomethylated dmCpGs compared to dCas9:gRNAscr (bottom, pink), which are the same as pink inset in e. Range is 0 to −100. Gene structures are densely mapped and sparsely labeled at the bottom (dark blue). e Manhattan plot of all hypomethylated (>25% change in methylation) sites in dCas9:gRNA3:Cre cells compared to dCas9:gRNAscr:Cre. Significantly differentially methylated sites were considered under default methylKit conditions (q < 0.01, above horizontal blue line). CpGs circled in red and labeled with q-values represent two target Il33-002 CpGs (10 and 11) and the CpG circled in black represents the third-highest (top non-target) dmCpG ranked by q-value. Pink box highlights significant dmCpGs in chromosome 1, which are displayed in d. f Best alignments to gRNA3 and PAM sequence of four 100 bp regions surrounding (±50 bp) four selected off-target dmCpGs (of 641 total) from e. Dashes indicate mismatches. Vertical lines indicate matching base pairs. Matched base pairs in off-target region are also shown in blue. For the purposes of this representation, the adenine in the NAG PAM in considered a mismatch to the more active guanine in the NGG PAM. Top alignment (in black) shows the region containing the top off-target dmCpG by q-value, chr8:4802686, circled in black in e (14/23 mismatches). Second from top alignment displays the 100 bp off-target region containing a sequence with the most similarity to gRNA3 of all 641 100 bp off-target regions, as calculated by position-weighted mismatch algorithm CCTop (ten mismatches). Third from top alignment displays off-target region ranked second for similarity to gRNA3 by CCTop (eight mismatches but one is closer to 3′/PAM end than above). Final alignment shows the off-target region with the lowest mismatches overall to gRNA3, regardless of position, which is 7. g Volcano plot of ChIP-seq significantly differentially enriched regions in gRNA3 and gRNAscr conditions (n = 3) for anti-FLAG ChIP-seq against FLAG-dCas9, using input as control. Log2 fold change (log2(gRNAscr) − log2(gRNA3)) is plotted on the x-axis and −log10(False Discovery Rate) is plotted on the y-axis. The locus corresponding to the Il33-002 transcription start site is circled in red. h Genome browser view (mm10) of Il33-002 (blue). Statistically significant peak (turquoise) (circled in red in g), peak summit (purple) and gRNA3 sequence (pink) are labeled. i Manually curated sequence alignments of top five DERs from ChIP-seq data to gRNA3 and PAM sequence. Identical sequence matches are marked in blue and bolded. Potential gaps are indicated with dashes. Chromosomal locations are given for the mm10 genome build. j Volcano plot depicting changes in methylation and associated statistical probabilities in dCas9:gRNA3 NIH-3T3 cells (from WGBS data) for CpGs that are within 150 differentially enriched off-target regions bound by dCas9:gRNA3 (Il33-002 is excluded). Change in methylation (x-axis) is expressed as mean percent methylation in dCas9:gRNAscr subtracted from mean percent methylation in dCas9:gRNA3. Statistical probabilities are provided as the −log10 of the p-value derived by the independent t-test as corrected for multiple testing by the False Discovery Rate method. Five hundred and forty-nine CpGs were located in DERs after filtering for CpGs that were 5× covered in all six samples; however, 132 CpGs with exactly 0% methylation in all six samples and 13 CpGs with exactly 100% methylation in all six samples are not depicted as P-values cannot be mathematically calculated. Therefore, 404 CpGs are shown. Underlying WGBS data was presented above and reflects n = 3 independent stable cell lines. Source data are provided as a Source Data file.

