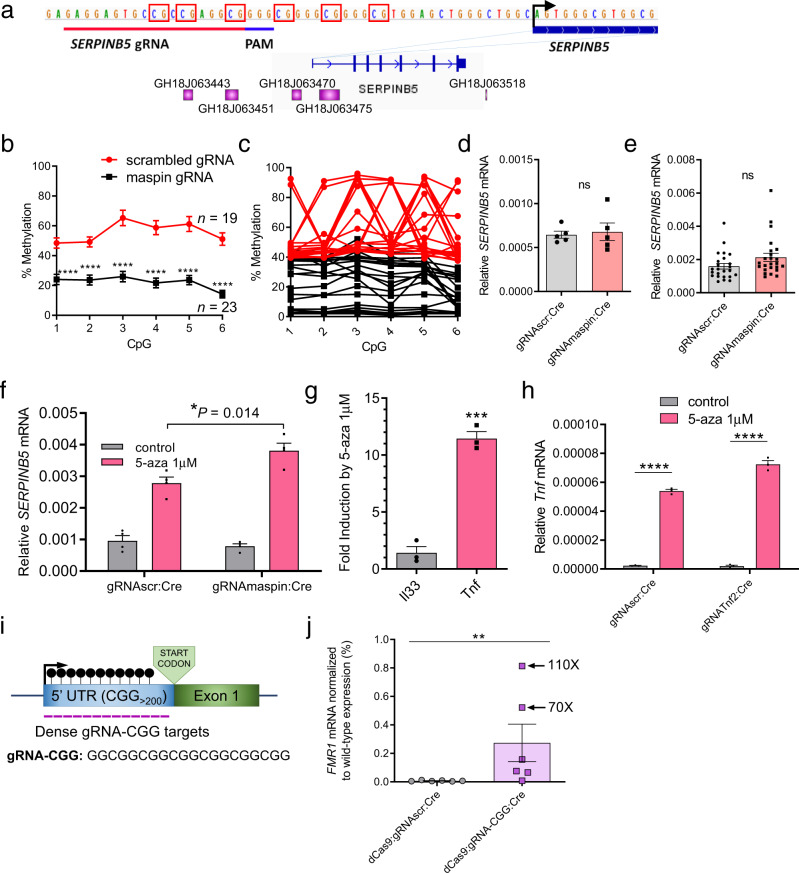
Fig. 7. The effect of dCas9-based demethylation of TSS on expression of SerpinB5, Tnf, and FMR1 genes.
a (Top) Schematic of the human SERPINB5 promoter region, including the start site of transcription (marked by black arrow) and the binding site and PAM of the SERPINB5 gRNA. CpG sequences are boxed in red. (Bottom) SERPINB5 gene with purple boxes indicating enhancer positions relative to gene body: enhancer IDs correspond to the GeneHancer database. b DNA methylation level of each CpG averaged over n = 19 gRNAscr (red) and n = 23 gRNASERPINB5 (black) independent MDA-MB-231 clones isolated from three independent treatments of cell cultures as assessed by pyrosequencing (mean ± SEM). c Same data as (b) except now shown as the calculated methylation fraction for each of the 19 gRNAscr (red) and 23 gRNASERPINB5 (black) clones, rather than the average of all clones. d SERPINB5 expression levels measured by RT-qPCR and normalized to GAPDH expression levels for five gRNAscr and five lowly-methylated gRNASERPINB5 clones (mean ± SEM, n = 5 biologically independent clones). e SERPINB5 expression levels (mean ± SEM) measured by RT-qPCR and normalized to GAPDH expression levels for 48 (n = 24 for each treatment) MDA-MB-231 clones subcloned from the clones in (d). f SERPINB5 expression levels (mean ± SEM) measured by RT-qPCR and normalized to GAPDH expression levels for clones from (d) following treatment with 1 µM 5-aza-2′-deoxycytidine or water control (n = 5 biologically independent experiments). g Expression fold change of murine Il33-002 (gray) and Tnf (pink), normalized to Actb and water control (mean ± SEM), following treatment of control NIH-3T3 cells with 1 µM 5-aza-2′-deoxycytidine (n = 3 biologically independent experiments). h Tnf expression (mean ± SEM) in NIH-3T3 cell lines in control (water); gray bars) or 1 µM 5-aza-2′-deoxycytidine (pink bars) stably expressing either gRNAscr or gRNATnf2 under high-puromycin conditions in combination with dCas9, followed by dCas9 removal by Cre recombinase, as assayed by RT-qPCR and normalized to Actb expression (n = 3 biologically independent experiments). i Schematic of the human FMR1 repeat region showing the 5′ untranslated region (UTR) that is prone to CGG repeat expansion and methylation in Fragile X syndrome. Sequence of the gRNA targeting this region is shown (gRNA-CGG) and the extent of the available binding sites for this gRNA is represented by purple lines which indicate binding sites: the 13 presented here represent less than 15% of the available binding site in the Fragile X syndrome patient primary fibroblasts used in this study, which have approximately 700 CGG repeats. j FMR1 expression quantified by RT-qPCR and normalized to GAPDH expression levels in Fragile X syndrome patient primary fibroblasts that had stably expressed dCas9 (later removed with Cre) and either gRNAscr (gray) or gRNA-CGG (purple) under high-puromycin selection (n = 6 biologically independent experiments, mean ± SEM). Data is represented as a percent of the expression of FMR1 in wild-type age-matched primary fibroblasts (Mann–Whitney test, two-sided). * indicates statistically significant difference of P < 0.05, **P < 0.01, ***P < 0.001, ****P < 0.0001, and ns not significant (Student’s t-test, two-sided, with Holm-Sidak correction if number of tests is greater than 3). Exceptionally, for (j) Mann–Whitney test was used due to unequal variance. Source data are provided as a Source Data file.

