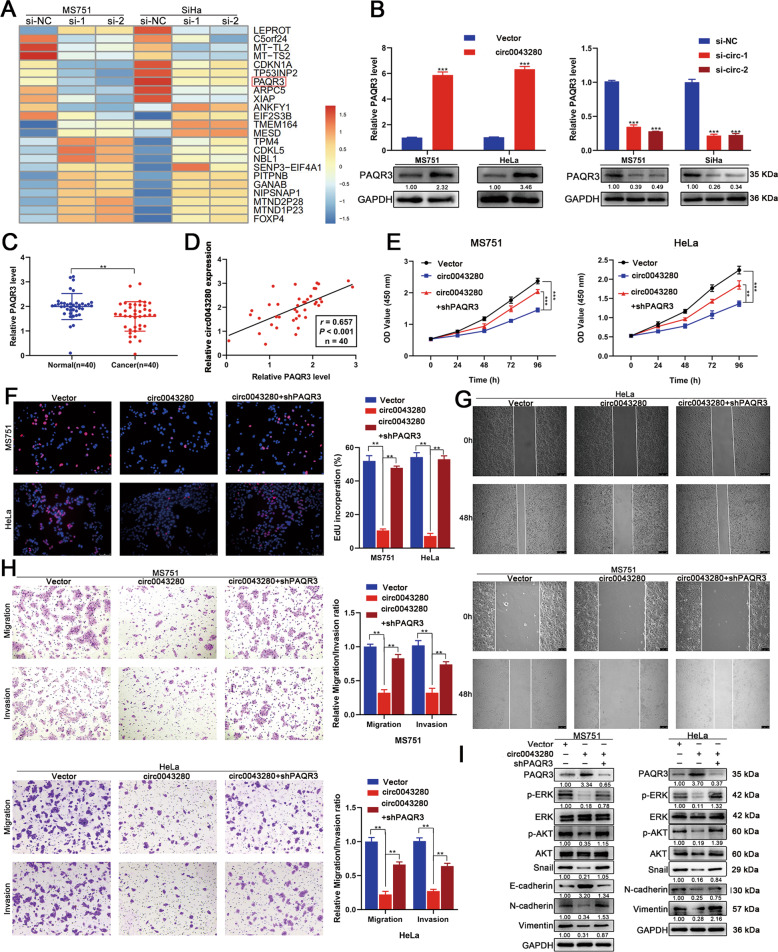
Fig. 4. PAQR3 is a downstream target of hsa_circ_0043280.
A RNA-seq analysis revealed the top 23 differentially expressed genes after the depletion of hsa_circ_0043280 in MS751 and SiHa cells. B PAQR3 mRNA and protein expression levels were analyzed by qRT-PCR and western blotting after hsa_circ_0043280 overexpression (left) or ablation (right). C Expression levels of PAQR3 in CCa tissues in comparison with normal tissues, as determined by qRT-PCR. D Scatter plot analysis of the correlation between mRNA expression levels of hsa_circ_0043280 and PAQR3 in 40 fresh cervical cancer tissues. E, F Cell proliferation ability was detected by CCK-8 and EdU assays in the indicated cells. Original magnification, × 100. G Cell migration abilities were measured by wound healing assays in the indicated cells. Original magnification, × 100. H Transwell assays were used to detect the migration and invasion capabilities of the indicated cells. Original magnification, × 100. I Western blot analysis of the protein levels of several EMT markers Snail, E-cadherin, N-cadherin and Vimentin, p-ERK, and p-AKT, in the indicated cells. Each experiment was performed at least three times independently. **P < 0.01; ***P < 0.001.

