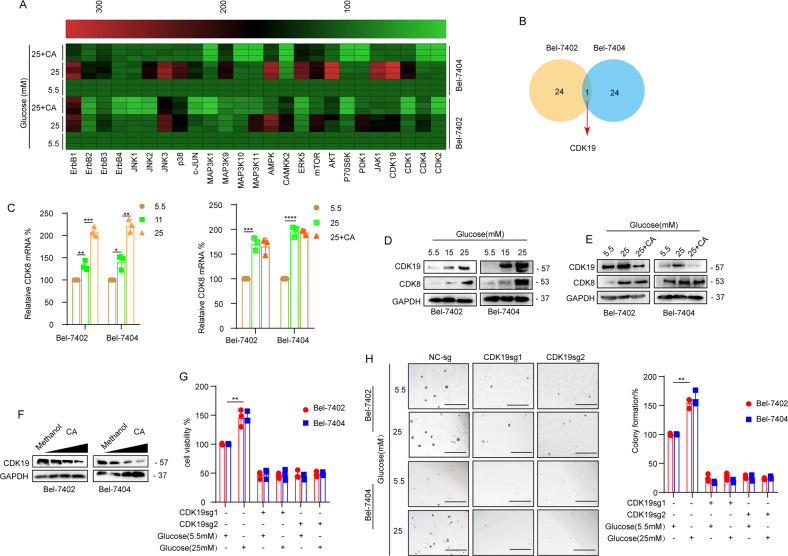
Fig. 4.
A, B RT-qPCR assay detected the mRNA expression levels of 25 different kinases in Bel-7402 and Bel-7404 cells and detailed information on one overlapping gene. C CDK8 was analyzed by qPCR in Bel-7402 or Bel-7404 cells subjected to the indicated treatments. D, E CDK19 and CDK8 were analyzed by WB in Bel-7402 or Bel-7404 cells subjected to the indicated treatments. F Representative WB images of CDK19 in Bel-7402 and Bel-7404 cells (transfected with 1–40 μM CA). G, H Cell proliferation and colony-formation capacity were measured with CCK-8 cytotoxicity tests (G) and soft agar colony-formation assays (H), respectively, in Bel-7402 and Bel-7404 cells subjected to different treatments as indicated. Scale bar, 500 μm. Data are shown as mean ± SD. *P < 0.05, **P < 0.01, ***P < 0.001, ****P < 0.0001.

