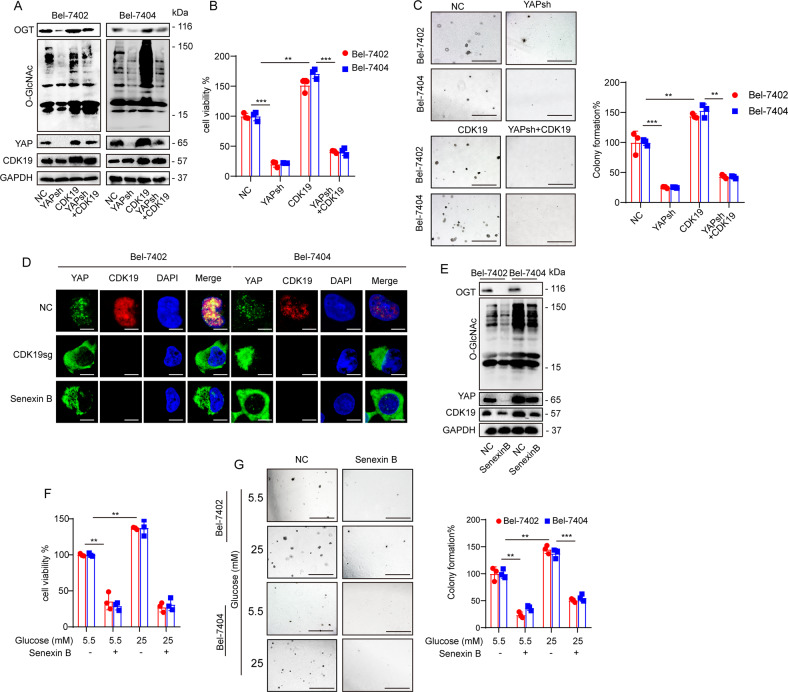
Fig. 6.
A–C The protein expression of OGT, O-GlcNAc, YAP, and CDK19 was measured by WB in cells subjected to the indicated treatments (A). Cell proliferation and colony-formation capacity were measured with CCK-8 cytotoxicity tests (B) and soft agar colony-formation assays (C), respectively, in Bel-7402 and Bel-7404 cells subjected to different treatments as indicated. Scale bar, 500 mm. D Subcellular localization of YAP and CDK19 in Bel-7402 and Bel-7404 cells subjected to the indicated treatments. Scale bar: 20 μm. E OGT, O-GlcNAc, YAP, and CDK19 in Bel-7402 and Bel-7404 cells subjected to different treatments as indicated were measured by WB. F, G Cell proliferation and colony-formation capacity were measured with CCK-8 cytotoxicity tests (F) and soft agar colony-formation assays (G), respectively, in Bel-7402 and Bel-7404 cells subjected to different treatments as indicated. Scale bar: 500 µm. Data are shown as mean ± SD. **P < 0.01, ***P < 0.001.

