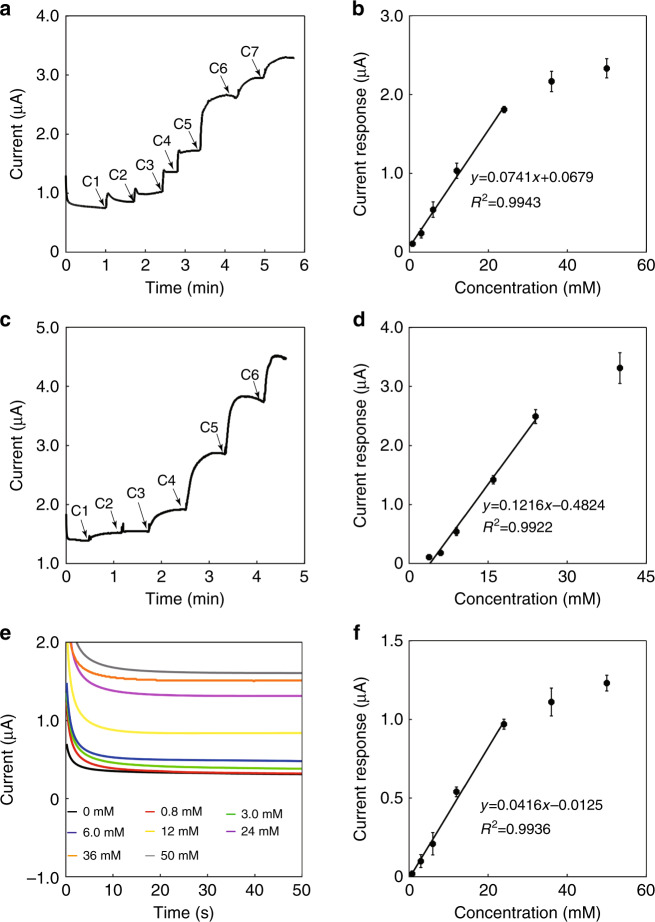
Fig. 4. In vitro sensing of glucose in different solutions with the biosensing device.
a Current versus time curve upon the addition of glucose in PBS. (C1: 0.8 mM, C2: 2.2 mM, C3: 3.0 mM, C4: 6.0 mM, C5: 12 mM, C6: 12 mM, C7: 14 mM). b Calibration curve for the detection of glucose in PBS. c Current versus time curve upon the addition of glucose to goat plasma (C1: 0.8 mM, C2: 2.2 mM, C3: 3.0 mM, C4: 7.0 mM, C5: 8.0 mM, C6: 16 mM). d Calibration curve for the detection of glucose in goat plasma. e Current versus time curve from simulated interstitial fluids with different glucose concentrations. f Calibration curve for the detection of glucose in simulated interstitial fluids. Each error bar was from three sensors

