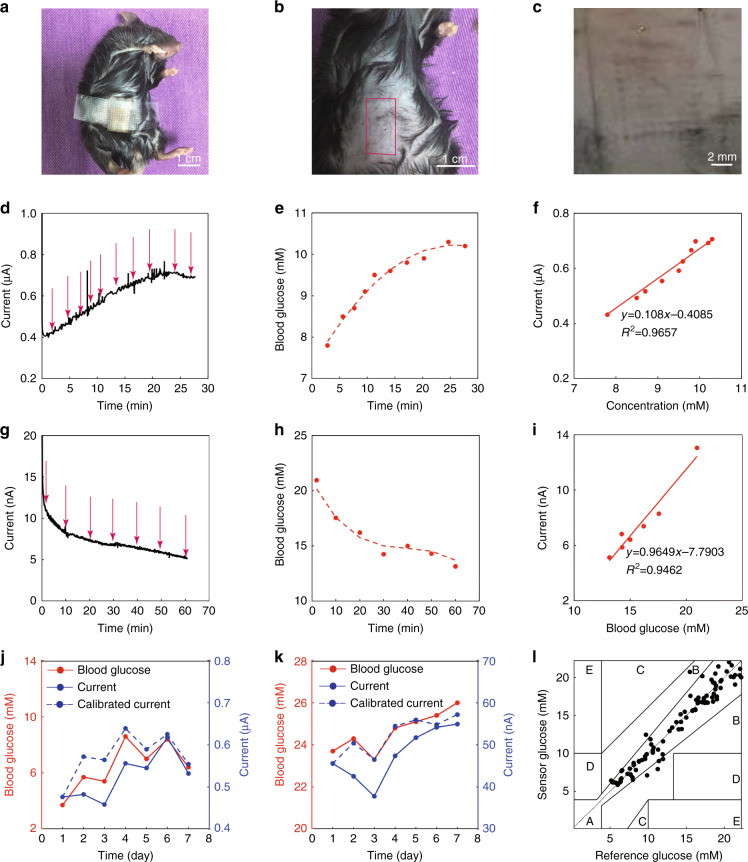
Fig. 5. In vivo monitoring of subcutaneous glucose in mice with the biosensing device.
a A camera image of the microneedle array applied to a mouse. b A camera image of a mouse’s skin on the abdomen after the application of the microneedle array biosensor. c A magnified image of the needle pores left on the mouse’s skin after the application of the microneedle array biosensor. d Current versus time curve of the biosensing device for detecting subcutaneous glucose in a normal mouse after being injected with glucose. Blood glucose was measured at the time indicated by the arrow by using a commercial blood glucose meter. e Blood glucose versus time curve for a normal mouse after being injected with glucose, measured by a commercial blood glucose meter. f Correlation between the subcutaneous glucose levels measured by the microneedle biosensing device and the blood glucose levels measured by a commercial glucose meter for a normal mouse after being injected with glucose. g Current versus time curve of the biosensing device for detecting subcutaneous glucose in a diabetic mouse after being injected with insulin. Blood glucose was measured at the time indicated by the arrow by using a commercial blood glucose meter. h Blood glucose versus time curve for a diabetic mouse after being injected with insulin, measured by a commercial blood glucose meter. i Correlation between the subcutaneous glucose levels measured by the microneedle biosensing device and the blood glucose levels measured by a commercial glucose meter for a diabetic mouse after being injected with insulin. j Seven-day monitoring of the subcutaneous glucose levels in a normal mouse by the microneedle biosensing device (blue), in comparison with a commercial blood glucose meter for blood glucose (red). k Seven-day monitoring of the subcutaneous glucose levels in a diabetic mouse by the microneedle biosensing device (blue), in comparison with a commercial blood glucose meter for blood glucose. l Clark error grid for the microneedle biosensing device. The x-axis represents the reference blood glucose values measured by a commercial blood glucose meter, and the y-axis displays the glucose values measured by the microneedle biosensing device (the data were from eight normal and eight diabetic mice)

