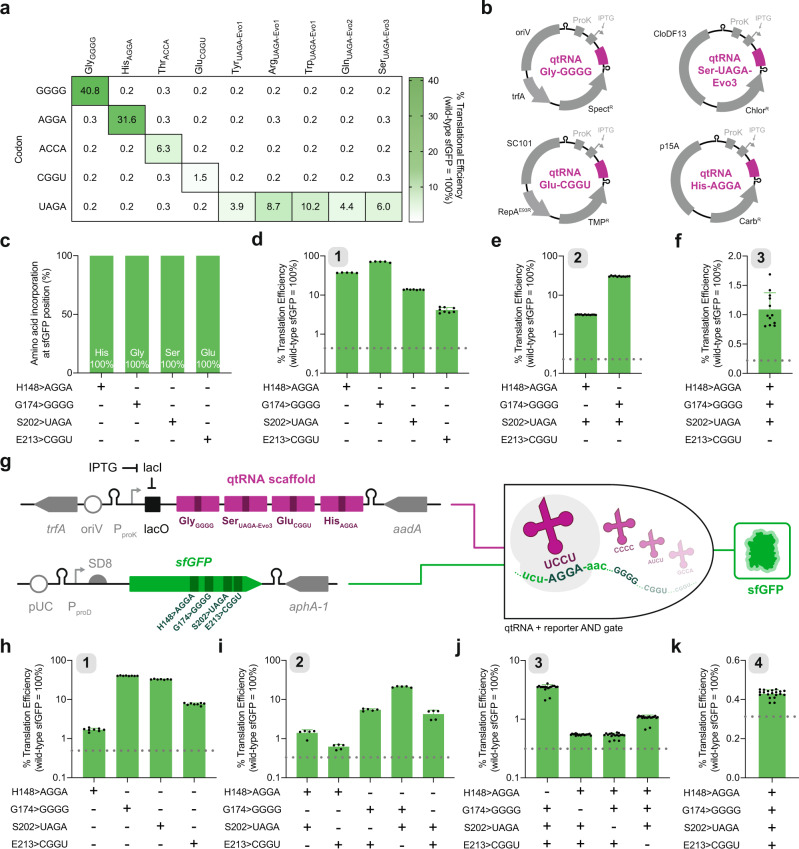
Fig. 5. Multiplex quadruplet codon suppression in sfGFP.
a Engineered and evolved qtRNAs showcase robust mutual orthogonality position Y151 of sfGFP. Expected codon-qtRNA interactions are outlined. b Schematic representation of orthogonal qtRNA expression plasmid architecture, including qtRNA, plasmid origin, and antibiotic resistance markers. c The sfGFP reporter previously described was first used to quantify amino acid incorporation at positions throughout sfGFP via mass spectrometry. Comprehensive peptide fragmentation spectra are reported in Supplementary Figure 11 and summary LC-MS/MS results are reported in Supplementary Table 8. Using a reporter with unique quadruplet codons in sfGFP alongside orthogonal qtRNA expression plasmids encoding qtRNAGlyGGGG, qtRNASerUAGA-Evo3, qtRNAGluCGGU, and/or qtRNAHisAGGA enables the translation of one (n = 5 biologically independent samples except for S202 > UAGA n = 7 and E213 > CGGU n = 8) (d), two (n = 12 and n = 11 biologically independent samples, respectively) (e), and three (n = 12) (f) unique quadruplet codons in a single reporter gene. g Schematic representation of the engineered multicistronic qtRNA scaffold and reporter plasmid encoding multiple quadruplet codons in sfGFP. Production of full-length sfGFP is dependent on the translation of up to four quadruplet codons. Expression of qtRNAGlyGGGG, qtRNASerUAGA-Evo3, qtRNAGluCGGU, and qtRNAHisAGGA from a single multicistronic qtRNA scaffold enables the translation of one (n = 8 biologically independent samples except for S202 > UAGA n = 7) (h), two (n = 5 biologically independent samples) (i), three (n = 18 biologically independent samples except for H148 > AGGA/G174 > GGGG/S202 > UAGA n = 20) (j) and four (n = 20 biologically independent samples) (k) quadruplet codons in sfGFP. Comprehensive peptide fragmentation spectra are reported in Supplementary Figs. 14–17. In all cases, reporter data is normalized to an otherwise wild-type protein and color-coded by the used reporter. Dotted lines on each plot represent strain autofluorescence and gray boxes in the upper left corner of certain plots reflect number of quadruplet codons. Data represent the mean and standard deviation as appropriate.

