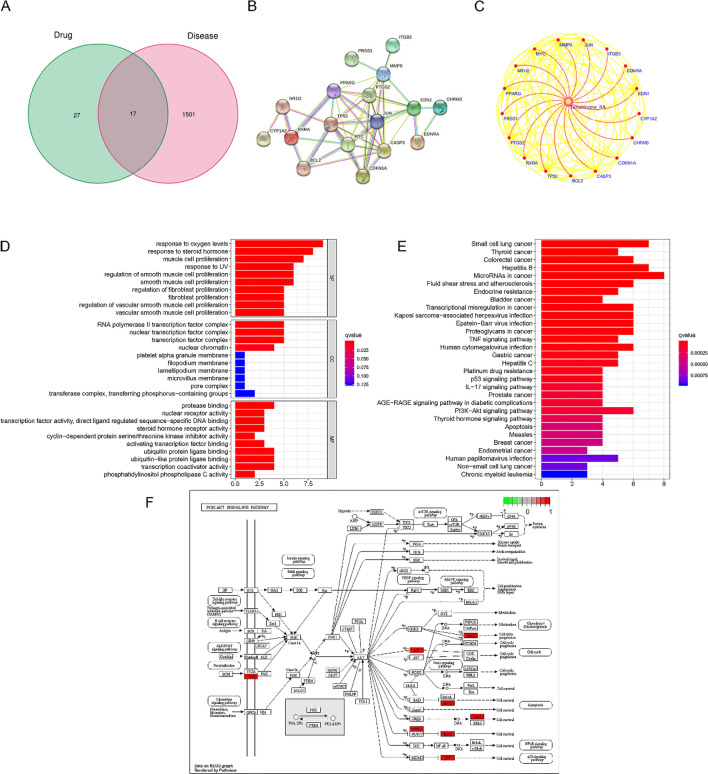
Figure 2.
Identifying common targets for Tan-IIA and Cholangiocarcinoma. (A) Venn diagrams were created by using the VennDiagram package12 in R software (version number: 4. 0. 0), depicting the intersection of Tan-IIA and Cholangiocarcinoma targets. (B) PPI network was constructed using 17 common targets of Cholangiocarcinoma and Tan-IIA. (C) Cytoscape plotted the network pharmacology, using red and yellow lines to indicate the interactions between Tan-IIA and targets and target-to-target interactions. GO and KEGG analysis of common targets. (D) GO functional enrichment was ran by using the clusterProfiler package14 in R software (version number: 4. 0. 0) and GO analysis of the enriched biological functions of the common target genes was performed (counts ≥ 30). (E) KEGG15,16 analysis of signaling pathways enriched by common target genes (counts ≥ 30). (F) Map of PI3K/AKT pathway obtained from KEGG analysis.

