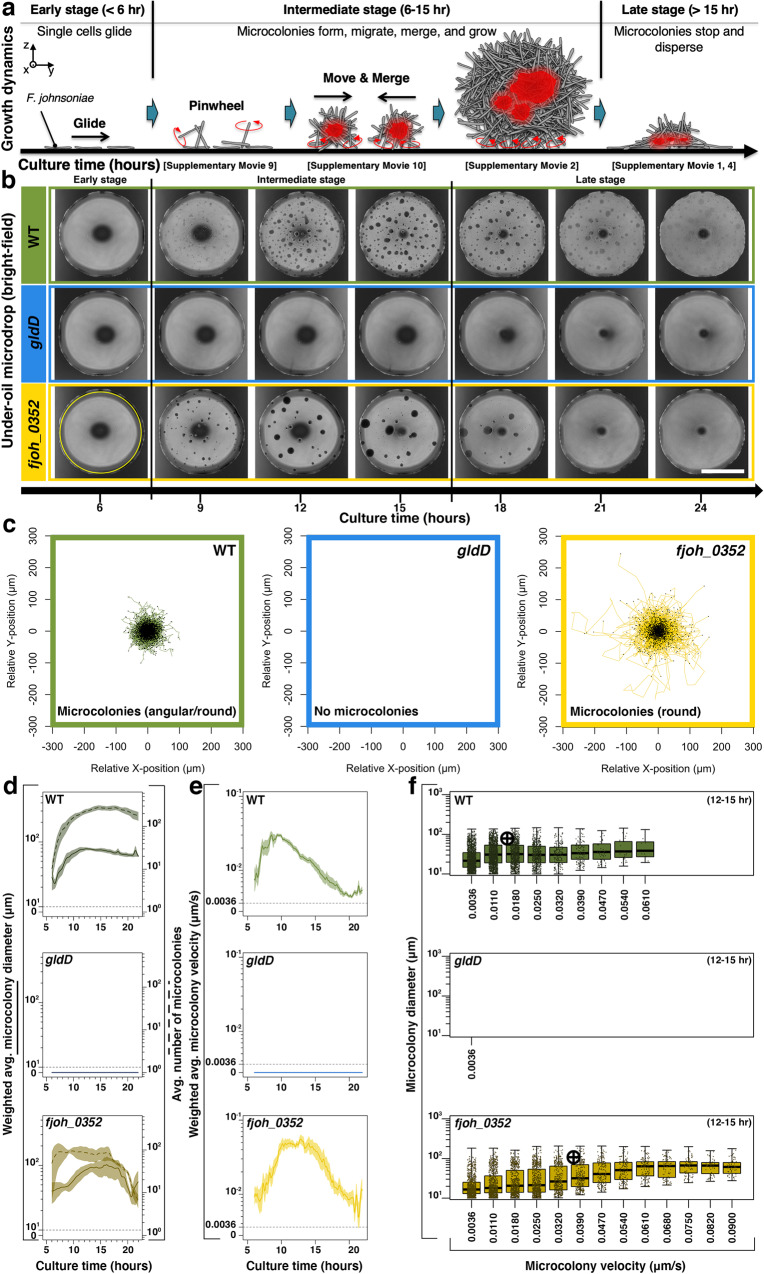
Fig. 2. Growth dynamics and microcolony motility.
a Schematic shows typical stages of the growth dynamics. In the early stage (< 6 h after initiating culture growth), the bacteria remain mostly as single cells and glide with minimal aggregation. In the intermediate stage (6–15 h), microcolonies start to form, migrate, merge, and grow. In the late stage (>15 h), microcolonies stop moving and disperse into single cells. b Comparison matrix with bright-field microscopic images between wild-type (WT) (green), gldD (blue), and fjoh_0352 (yellow) over time. Scale bar, 1 mm. The experiments were performed three times for the representative result. c Spider plots of the track displacement from 6 to 21 h. A region of interest (ROI) (1.84 mm in diameter, the yellow solid line circle in b was set in particle tracking to avoid artifacts from the edge of the microdrop. All of the starting points of the movement of microcolonies converged to the origin (i.e., x = y = 0 μm). d Weighted average microcolony diameter (solid line) and average number of microcolonies (dashed line) versus culture time (step, 5 min). e Weighted average microcolony velocity versus culture time (step, 5 min). Estimated microcolony volumes were used as weights for all weighted average calculations. The standard error is represented by the envelope on the plots in d and e. f Strip plots show the distribution of microcolony diameter versus microcolony velocity at the growth window (12–15 h). Data points were pooled from three biological replicates. Crosses indicate medians. Box edges and center represent the 25th, 75th, and 50th percentile while whiskers represent 1.5 × IQR (interquartile range) or the minima and maxima (whichever is less). Source data are provided as a Source Data file.

