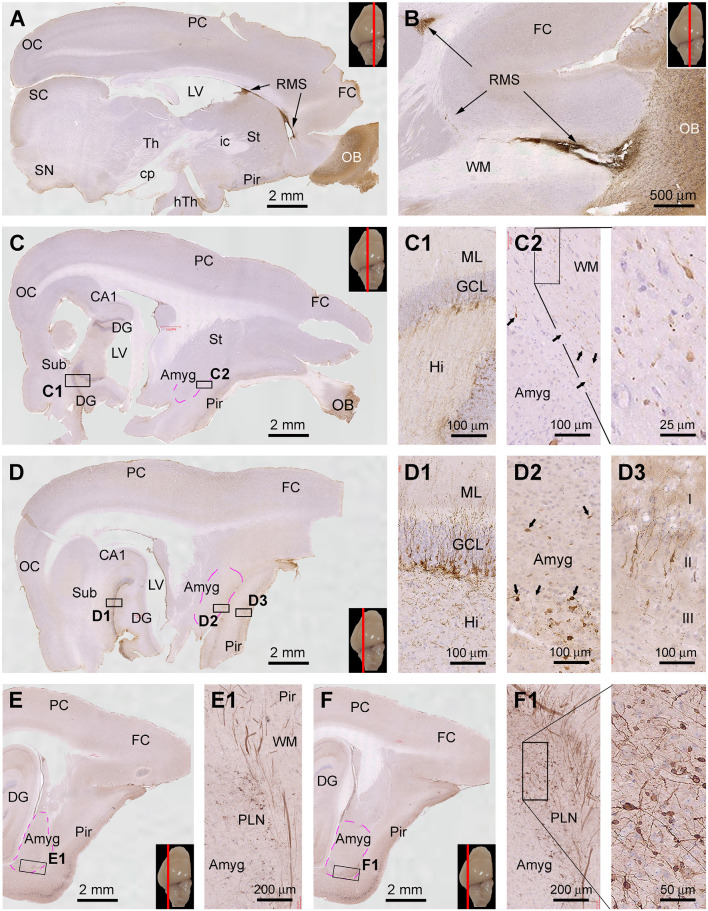
Figure 8.
Topographic distribution of DCX+ cellular profiles in sagittal cerebral sections from a 6-month-old animal, with hematoxylin counterstain. The approximate medial to lateral planes of the sections in reference to the top view of the brain are marked with a red line in the image panels. Framed areas in the low magnification images are enlarged as indicated. The area of the amygdalar complex (Amyg) is marked with broken purple lines (C–F). Panels (A,B) show the immunolabeling in the subventricular zone (SVZ) forming the rostral migratory stream (RMS) extending into the olfactory bulb (OB). Panels (C,D) show the distribution of DCX+ neurons in the hippocampal dentate gyrus (DG), Amyg, and piriform cortex (Pir), with the framed areas enlarged as (C1,C2), and (D1–D3) as indicated. Panels (E,F) are images at more lateral planes, in which the DCX+ cells in the Amyg are distinctly present in the area of the paralaminar nucleus (PLN) (E1,F1). Additional abbreviations: FC, frontal neocortex; PC, parietal neocortex; OC, occipital neocortex; Th, thalamus; hTh, hypothalamus; St, striatum; Sub, subiculum; GCL, granule cell layer; ML, molecular layer; Hi, hilus; WM, white matter. Scale bars are as indicated.

