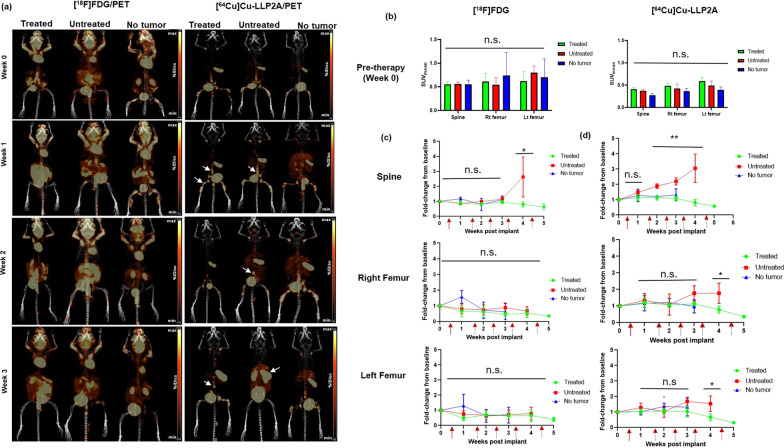
Fig. 3.
a Representative small animal maximum intensity projection (MIP) [18F]FDG and [64Cu]Cu-LLP2A PET images in disseminated MM.1S-CG tumor mice (treated and untreated) as well as in no tumor mouse cohorts, respectively. Bortezomib therapy was started in the treatment cohort between weeks 0–1. White arrows are pointing to the selected focal tumor lesions in the treated and untreated mice imaged with [64Cu]Cu-LLP2A/PET. Scale Bar ([18F]FDG): Min 4% ID/cc, Max 8% ID/cc; Scale Bar ([64Cu]Cu-LLP2A): Min 3% ID/cc, Max 6% ID/cc. b [18F]FDG and [64Cu]Cu-LLP2A PET quantification (SUVmean) of the bone marrow rich organs – spine, right (Rt) femur and left (Lt) femur, in MM.1S-CG disseminated tumor model and no tumor mice at week 0 (baseline, before therapy was started). c [18F]FDG SUV fold-change from baseline in the spine, right (Rt) femur and left (Lt) femur in MM.1S-CG tumor (treated and untreated) mice and no tumor mice, plotted as a function of time. d [64Cu]Cu-LLP2A SUV fold-change from baseline in the spine, right (Rt) femur and left (Lt) femur in MM.1S-CG tumor mice (treated and untreated) and non-tumor mice, plotted as a function of time. *p ≤ 0.05, **p ≤ 0.01

