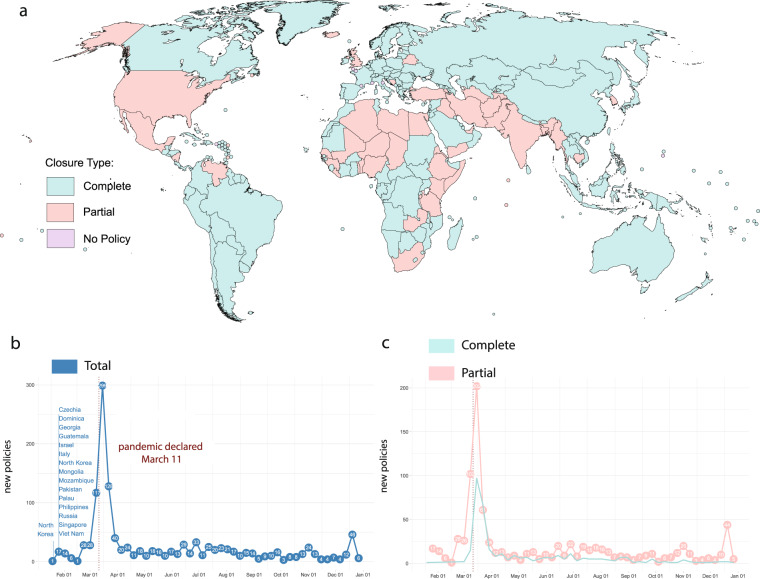
Fig. 1.
Scope of data collection. (a) Map of border closures enacted in total throughout 2020. The teal color indicates the countries that enacted complete closures at any point in 2020, and pink indicates the same for partial closures. If a country instituted both, we show the complete closure color. Countries for which there were no policies are purple. (b) New policy counts over time and an indication of the official start of the COVID-19 pandemic on 11-March 2020. The first countries to enact new policies are listed on the chart. (c) Breakdown of new complete (teal) and partial (pink) closures over time.

