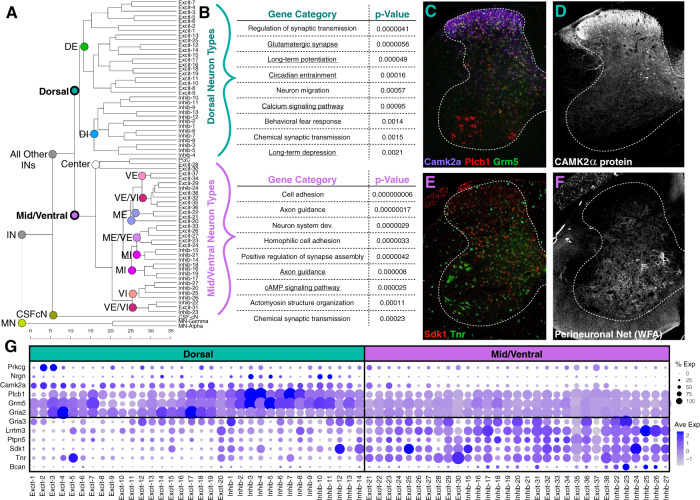
Fig. 3. Trends in dorsal-ventral organization of spinal cord neuron types.
a Dendrogram showing the relationships between the 69 neuronal cell types based on their distance from each other in the 50-dimensional principal component (PC) space. MN motoneuron, IN interneurons (and projection neurons), CSF-cN cerebrospinal fluid contacting neurons, DE dorsal excitatory, DI dorsal inhibitory ME mid excitatory, MI mid inhibitory, VE ventral excitatory, VI ventral inhibitory, center represents a group of 3 cell types located near lamina X–the center of the spinal cord. b Differential gene expression tests (ROC) were used to compare overall gene expression between the dorsal cell types and mid/ventral cell types and significant gene lists were analyzed by gene ontology (GO) term searches with GO DAVID using molecular function and biological process terms, as well as KEGG pathway lists (which are underlined) and the top terms for each cell class are shown. c–f Validation of differentially expressed genes using RNA in situ hybridization (c, e), antibody staining (d), or WFA-lectin staining (f). 20x tiled images, with brightness and contrast adjusted. All images are representative of the pattern observed in at least 3 sections each from N = 3 animals. Scale bars are 200 μm. g Dot plots showing expression of plasticity-related genes in each harmonized cluster, in which dot color intensity corresponds to average expression level (Ave Exp) and dot size corresponds to the percent of each cluster that expressed the gene (% Exp).

