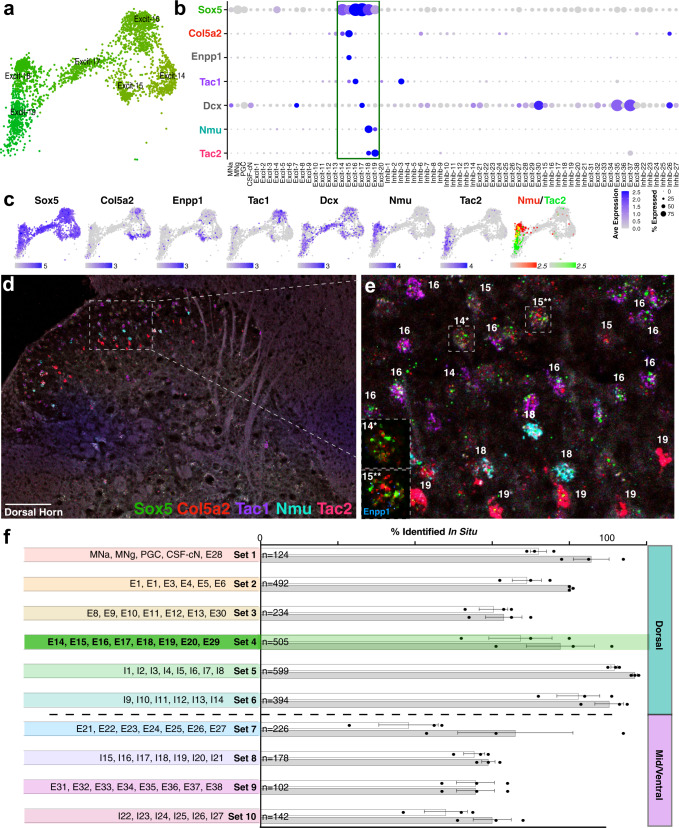
Fig. 4. Family structure and in situ validation for adult spinal cord tissue.
a UMAP for neuronal cell types Excit-14 through Excit-19. b Dot plot of the distribution of selected marker genes across the 69 neuronal clusters in which dot color intensity corresponds to average expression level (Ave Expression) and dot size corresponds to the percent of each cluster that expressed the gene (% Expressed). c Feature plots of each gene expression pattern in Excit-14 through Excit-19. Expression levels are indicated by color intensity, with the maximum level indicated below each plot. The co-expression of Nmu (red) and Tac2 (green) are shown in the right-most plot, with expression levels cut-off at a maximum of 2.5 to highlight co-expressing cells in yellow. d, e RNA in situ hybridization of selected marker genes Sox5, Col5a2, Tac1, Nmu, Tac2 on an adult mouse lumbar spinal cord section. Cells were assigned to individual excitatory clusters with cluster number identity shown based on marker gene expression. Inset show representative cells of Excit-14 (14*) and Excit-15 (15**) with in situ hybridization for Sox5 (green), Col5a2 (red), Enpp1 (blue). 20x tiled images, with brightness and contrast adjusted. All images are representative of the pattern observed in at least 3 sections each from N = 3 animals. Scale bar is 100 μm in (d) and 25 μm in (e). f Quantification of the cells in adult spinal cord tissue that could be defined using sets of marker genes in situ. The cell types analyzed by each set of genes are shown on the left, the number of cells counted for each set are shown at the base of the bars, and the percent of counted cells are shown for each animal (N = 3, replicates and mean ± standard error) that could be confidently assigned to a single cluster (white bars), or that could be assigned to a single cluster or to pair of closely related clusters (gray). For each set, the coarse criteria for counting total cells are specified in the Methods. Set 4, which includes the Sox5 family clusters, is highlighted in green as an example.

