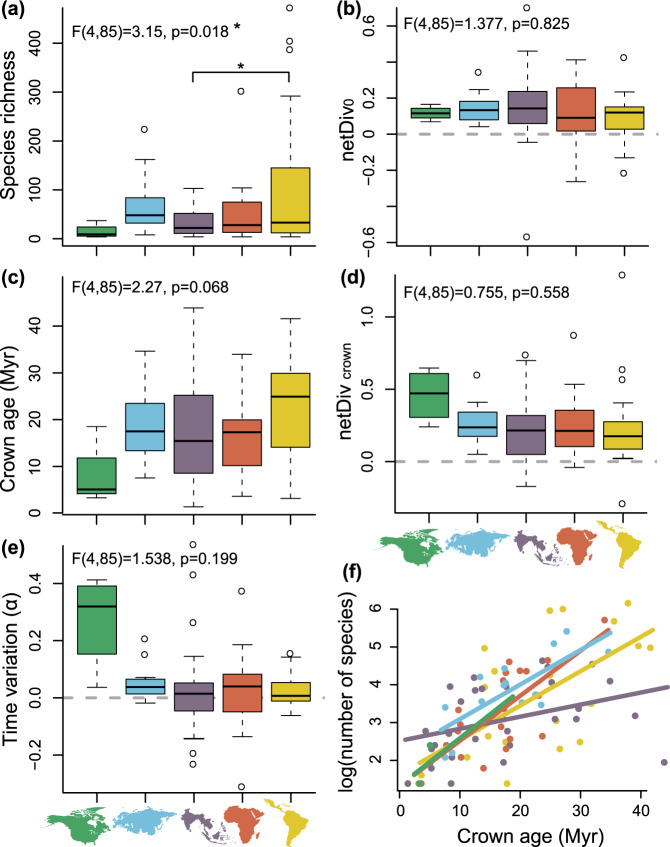
Fig. 4. Estimated parameter distributions of 90 regional diversification events.
a Extant number of species in diversification events in the different regions. b Net diversification rate at the present (netDiv0) in different regions. c Crown age of diversification events in different regions. d Net diversification at the crown (netDivcrown) in different regions. e Time variation parameter (α) in different regions. f The log number of extant species within each diversification event regressed against its crown age, analyzed by region. Points, lines, and boxes are colored according to the biogeographic region they represent. Boxplots show the median, interquartile range, default whiskers, and outliers of parameter distributions. The results of a one-way ANOVA performed for every parameter are found above each boxplot. Source data are provided as a Source Data file.

