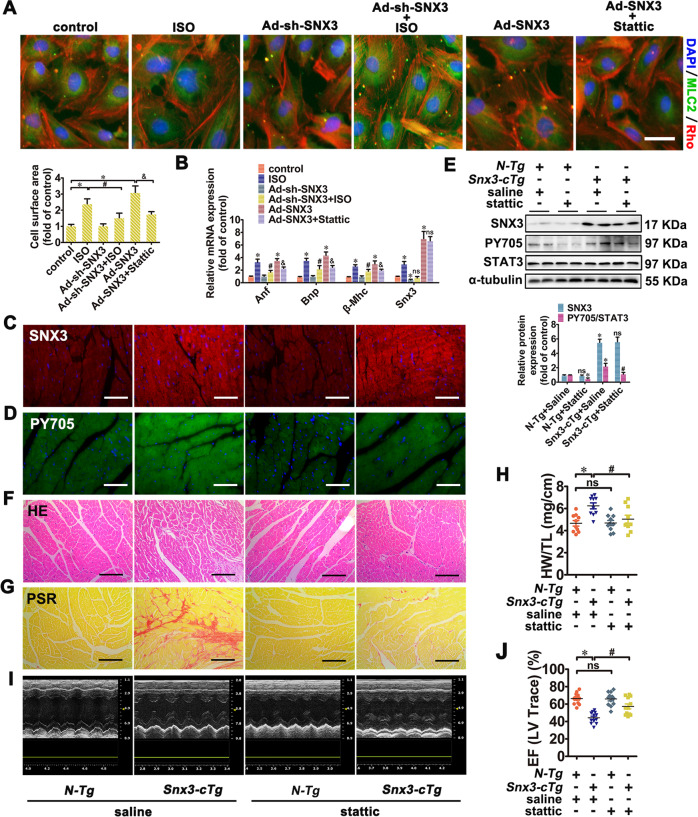
Fig. 6. STAT3 was involved in SNX3-mediated cardiomyocyte hypertrophy in NRCMs and in Snx3-cTg mice.
NRCMs were divided into four groups: (1) infected with Ad-sh-SNX3 before ISO treatment; (2) infected with Ad-SNX3 with or without stattic (5 μmol/L, 24 h); (3) transfected with si-STAT3 before infection of Ad-SNX3; (4) infected with Ad-STAT3 before transfection of Ad-sh-SNX3 in ISO-treated NRCMs. A The cell surface area was measured by staining with anti-MLC2 (green) and rhodamine-phalloidin (red) (Scale bar: 25 μm). B The mRNA expression of Anf, Bnp, β-Mhc, and Snx3 were measured by qPCR. Additionally, male Snx3-cTg mice (10-weeks-old) were administrated with stattic (40 mg/kg/d, i.p.) or an equal volume of vehicle for 2 weeks. C–E The protein expression of SNX3 and the phosphorylated STAT3 (pY705) were measured by IF (Scale bar: 100 μm) and western blot analysis. F and G HE staining (Scale bar: 100 μm) and PSR staining (Scale bar: 100 μm)-stained cross-sections of heart tissues were shown. H The HW/TL ratio was calculated. I The representative echocardiographic graphs was presented. J The echocardiographic parameter EF was measured. Representative images of five independent experiments were presented. The data were presented as the means ± SEM. *P < 0.05 vs. control, Ad-Flag, Ad-NC or N-Tg + Saline, group, #P < 0.05 vs.. ISO, Ad-SNX3 or Snx3-cTg + Saline group, &P < 0.05 vs. Ad-sh-SNX3 or Ad-SNX3 group, n = 5 for cell test. n = 12 per N-Tg (12w) + Saline group, n = 11 per Snx3-cTg (12w) + Saline group, n = 12 per N-Tg (12w) + Stattic group, n = 12 per Snx3-cTg (12w) + Stattic group. EF ejection fraction, HE hematoxylin–eosin, HW/TL the heart weight to the tibia length ratio, IF immunofluorescence, i.p. intraperitoneally, ISO isoproterenol, MLC2 myosin light chain 2, NC negative control, NRCMs neonatal rat cardiomyocytes, ns no statistical difference, N-Tg non-transgenic, PSR picric sirius red, qPCR quantitative polymerase chain reaction, Snx3-cTg cardiac-specific Snx3 transgenic, 1h 1 h. See also Supplementary Figs. S11, S15, S17–S19.

