
Figure 12.
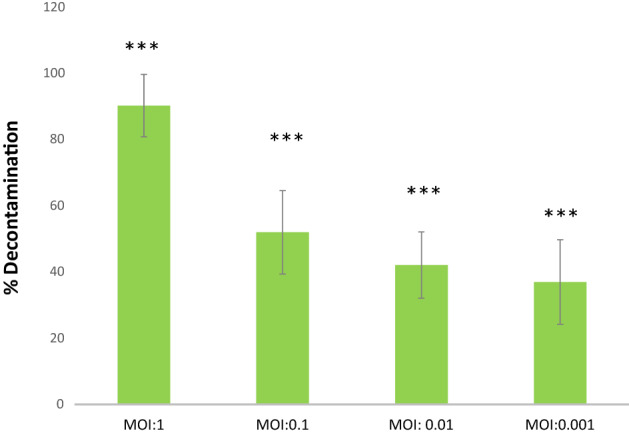
Graphical representation of results from decontamination assay experiments using artificially contaminated cover-slip model for contaminated surfaces. Decontamination of artificially contaminated glass cover slip with phage DRL-P1 application at different MOI (1.0, 0.1, .01, .001). MOI:0 represents control (no phage treatment). Bars represent average % reduction of P. aeruginosa after phage treatment at different MOIs. Data represents mean ± SD from the triplicate experiments. ***P < 0.001 indicates a significant difference between phage treatment at different MOI and the control with no phage treatment. Plots were generated using the chart function incorporated in Excel program (MS Office version 18.2106.12410.0) and statistical analysis were performed using the GraphPad PRISM computer program (Trial version 7.05; https://www.graphpad.com/scientific-software/prism/).