Figure 1.
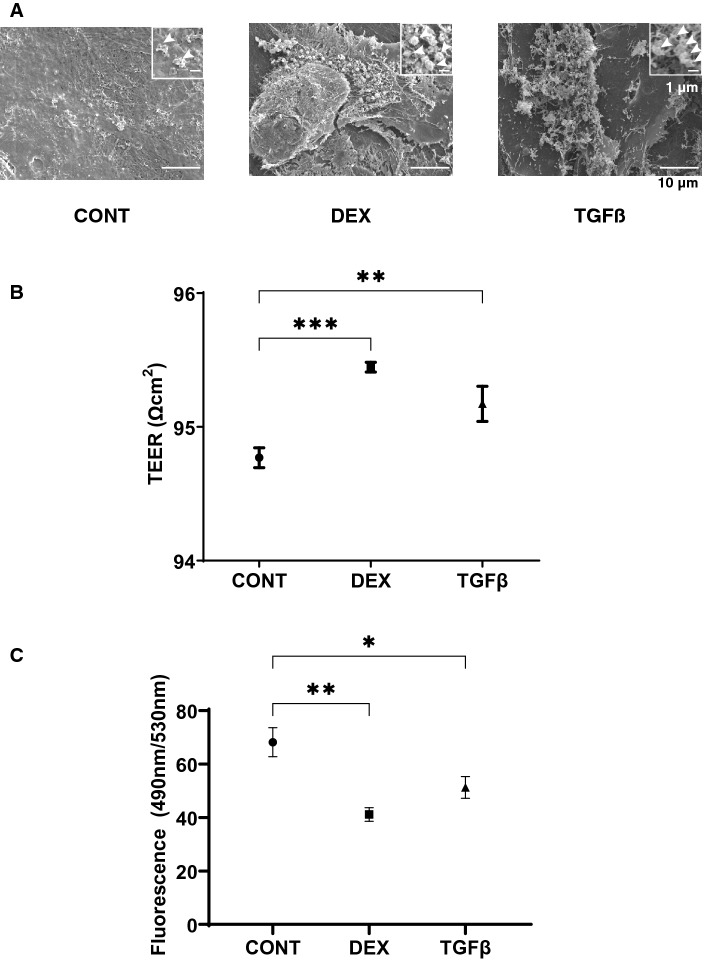
Representative scanning electron microscopic (SEM) images (A), transendothelial electrical resistance (TEER) (B) and FITC-dextran permeability (C) of 2D culture of HTM cell monolayer. Among the experimental groups treated without (CONT) or with 250 nM DEX or 5 ng/ml TGFβ2 (TGFβ), representative SEM images of 2D cultures HTM monolayer at Day 6 are shown (panel A, scale bar; 10 µm). Extracellular ECM deposits indicated by asterisks within inset of SEM images (scale bar; 1 µm) and numbers of ECM deposits within 5 × 5 µm2 (n = 5 different areas from 4 different preparations) were counted (CONT; 2.75 ± 1.47, DEX; 4.25 ± 0.83, TGFβ; 5.75 ± 0.83). To evaluate barrier function (Ω cm2) and the permeability of the 2D cultured HTM monolayers, TEER (panel B) and FITC-dextran permeability (panel C) measurements were made, respectively. All experiments were performed in triplicate using fresh preparations (n = 4). All data are presented as the arithmetic mean ± standard error of the mean (SEM). * P < 0.05, ** P < 0.01, *** P < 0.005 (ANOVA followed by a Tukey’s multiple comparison test).

