Figure 4.
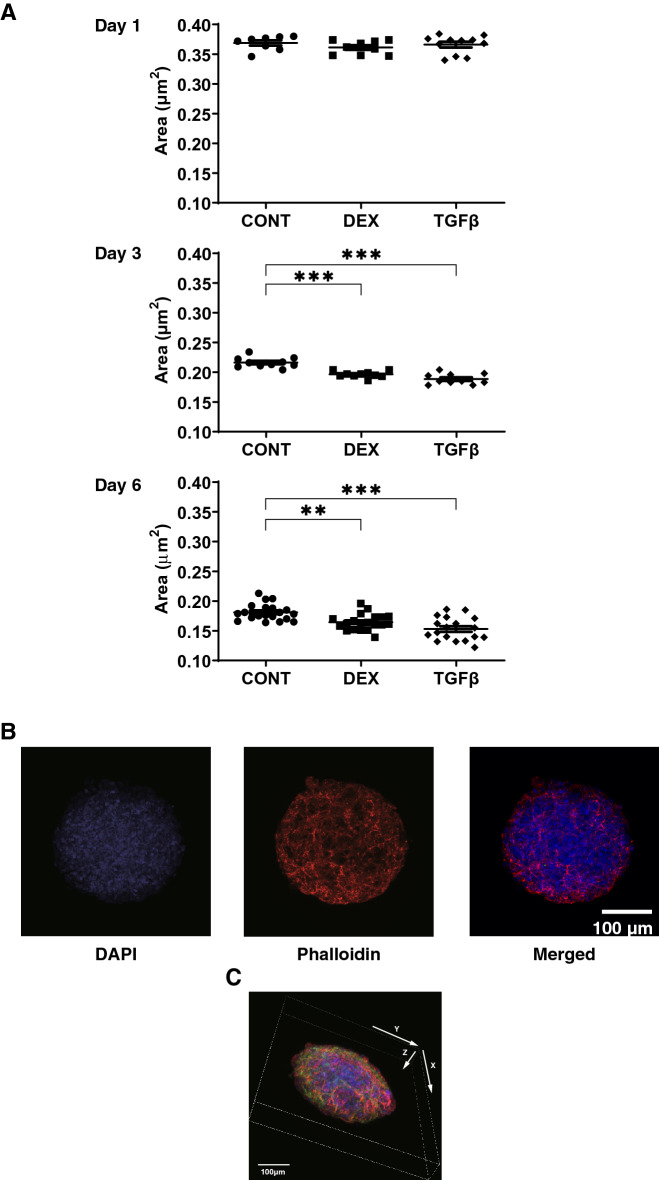
Changes in 3D HTM spheroid size (A) during their 3D culture in the presence or absence of DEX or TGFβ2, and representative 3D spheroid images stained by DAPI and phalloidin (B, C). Among the experimental groups treated without (CONT) or with 250 nM DEX or 5 ng/ml TGFβ2, changes in the mean size of 3D HTM spheroids during 3D culture at Days1, 3 and 6 were plotted in panel A. Representative immunolabeling XY axes plane image (panel B) and 3D XYZ axes image (panel C) of the 3D HTM spheroid (CONT) at Day 6 stained by DAPI and phalloidin. These experiments were performed in triplicate using fresh preparations (n = 10 or 5 for size measurement and immunolabeling, respectively). Data are presented as the arithmetic mean ± standard error of the mean (SEM). **P < 0.01; ***P < 0.005 (ANOVA followed by a Tukey’s multiple comparison test). Scale bar: 100 µm.

