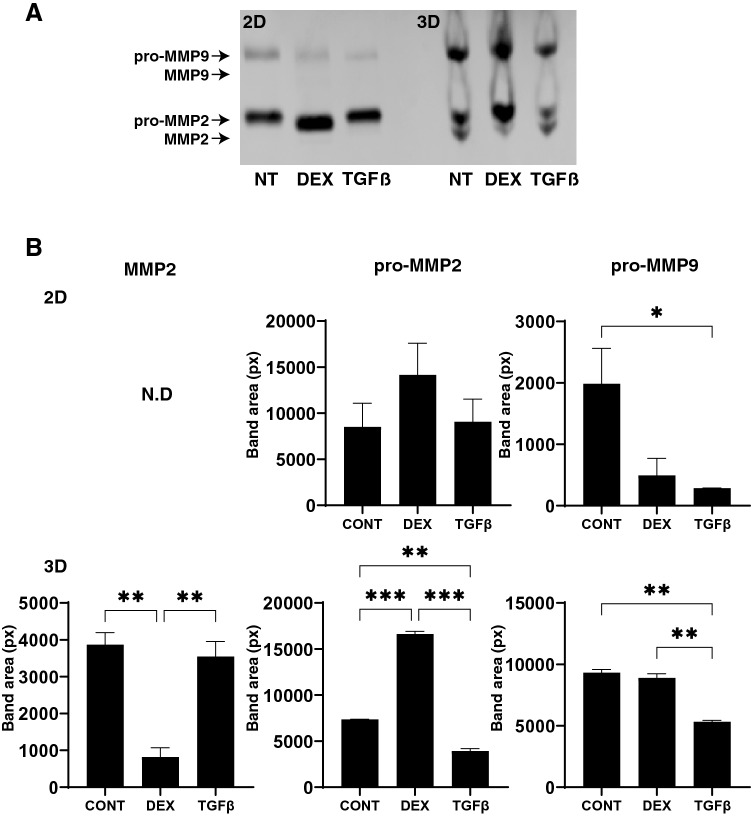
Figure 9.
Zymography of HTM 2D cells and 3D spheroids. Among the experimental groups treated with or without 250 nM DEX or 5 ng/ml TGFβ2, HTM 2D cells and 3D spheroids at Day 6 were subjected to zymography measurements (panel A). The corresponding MMP band areas were evaluated using Image J soft (panel B). All experiments were performed in duplicate using fresh preparations (n = 3). Data are presented as the arithmetic mean ± standard error of the mean (SEM). *P < 0.05; **P < 0.01; ***P < 0.005 (ANOVA followed by a Tukey’s multiple comparison test).

