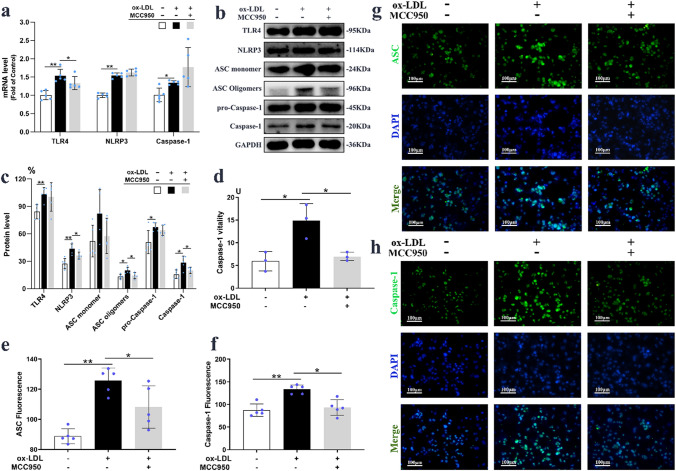
Figure 5.
MCC950 inhibited ox-LDL induced NLRP3 inflammasome activation in macrophages. The mRNA and protein (n = 5/group) expressions of TLR4, ASC, NLRP3, Caspase-1 in ox-LDL induced macrophages were shown on (a–c). The vitality of Caspase-1 was measured and presented on (d). The representative images and quantitation of ASC and Caspase-1 by immunofluorence staining (n = 5/group) were exhibited on (e–h). GAPDH served as an internal control. The magnification was ×200, Scale bar = 100 μm. Data were presented as mean ± SD. *P < 0.05 was considered significant, **P < 0.01.

