Figure 2.
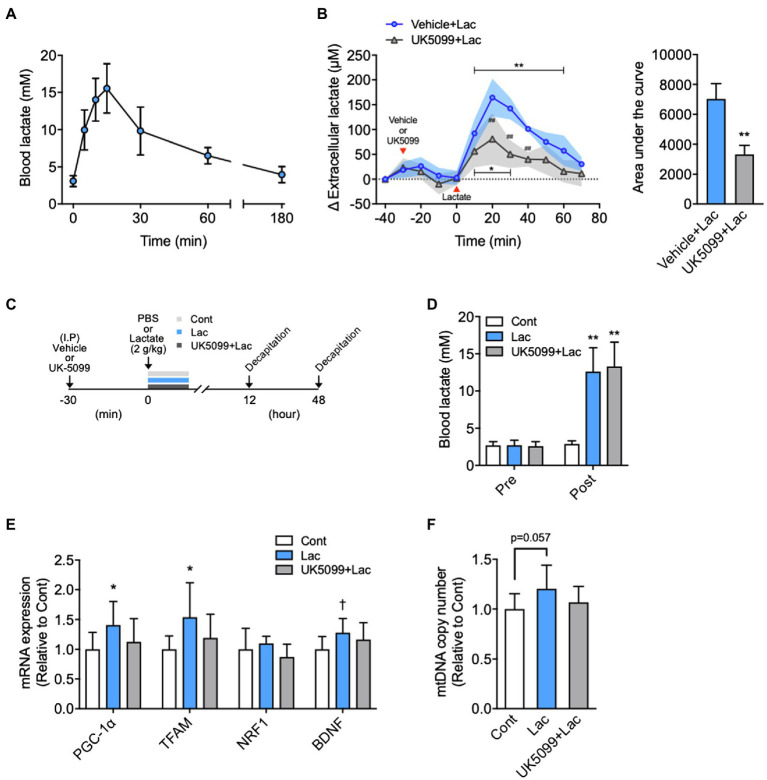
Effects of lactate administration on hippocampal extracellular lactate concentration and mitochondrial biogenesis in the hippocampus. (A) Time course changes in blood lactate concentration after I.P. lactate injection (2g/kg; n=6). (B) The hippocampal extracellular lactate concentration changes after I.P. lactate injection with saline or monocarboxylate transporters (MCT) inhibitor (UK5099) administration and area under the curve (Vehicle + Lac, n=4; UK5099+Lac, n=5). (C) Experimental design: Mice were injected saline or UK5099 by I.P. injection 30min before lactate administration. Blood lactate concentration was measured 15min after I.P. lactate or saline injection. (D) Blood lactate concentrations before I.P. lactate injection (Pre) and after lactate injection with and without UK5099 (Post). (E) PGC-1α, mitochondrial transcription factor A (TFAM), nuclear respiratory factor1 (NRF1), and brain-derived neurotrophic factor (BDNF) mRNA expression in the hippocampus 12h after I.P. lactate injection with and without UK5099 (Cont, n=9; Lac, n=9; UK5099+Lac, n=8). (F) mtDNA copy number in the hippocampus 48h after I.P. injection of lactate with and without UK5099 (Cont, n=10; Lac, n=10; UK5099+Lac, n=8). All data were presented as the mean±SD values. Data were analyzed using two-way ANOVA with Bonferroni’s post-hoc tests and unpaired t-test (AUC) (B) and one-way ANOVA with Tukey’s post-hoc tests (D–F). *p<0.05; **p<0.01; and †p<0.1 in comparison with baseline or Cont group and ##p<0.01 compared to Vehicle + Lac group.

