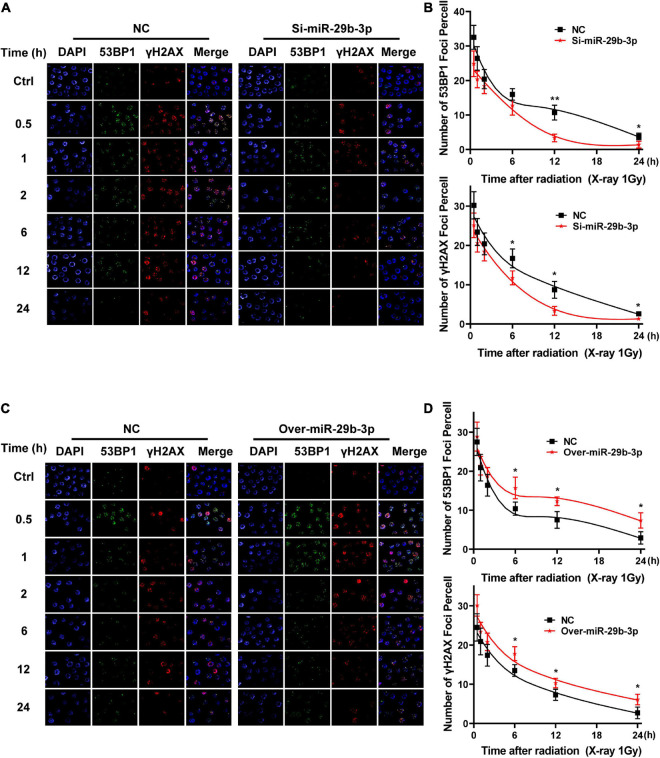
FIGURE 6.
Kinetics process of DNA damage repair in miR-29b-3p knockdown or overexpressed A549 cells. (A) Graph shows quantification of 53BP1 and yH2AX foci in miR-29b-3p knockdown and negative control A549 cells exposed to 1 Gy X-ray. (B) The numbers of 53BP1 and yH2AX foci in 50 cells of each group were counted for each time point. (C) Graph shows quantification of 53BP1 and yH2AX foci in miR-29b-3p overexpressed and negative control A549 cells exposed to 1 Gy X-ray. (D) The numbers of 53BP1 and yH2AX foci in 50 cells of each group were counted for each time point. Ctrl, unirradiated groups; NC, negative control. Significance was determined by unpaired t-test. *P < 0.05; **P < 0.01.

