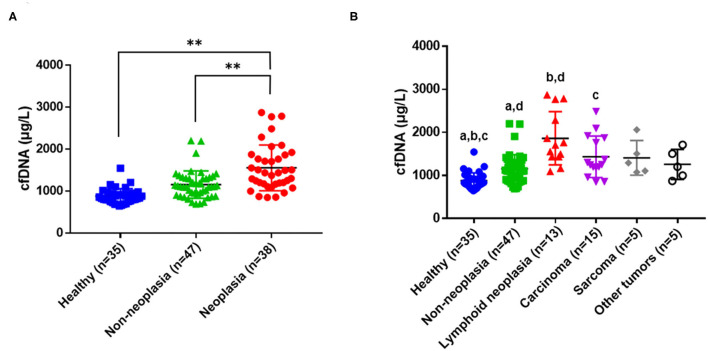
Figure 1.
Concentrations of cell-free DNA (cfDNA) in healthy dogs, dogs with underlying non-neoplastic diseases, and dogs with tumors. (A) Comparison of mean cfDNA concentrations among the healthy, non-neoplastic, and neoplastic groups (**P < 0.001 between groups). (B) Horizontal lines inside a plot indicate median values, and whiskers indicate interquartile ranges. The same letters (a, b, c, P < 0.01; d, P < 0.05) indicate a significant difference between a pair of data.

