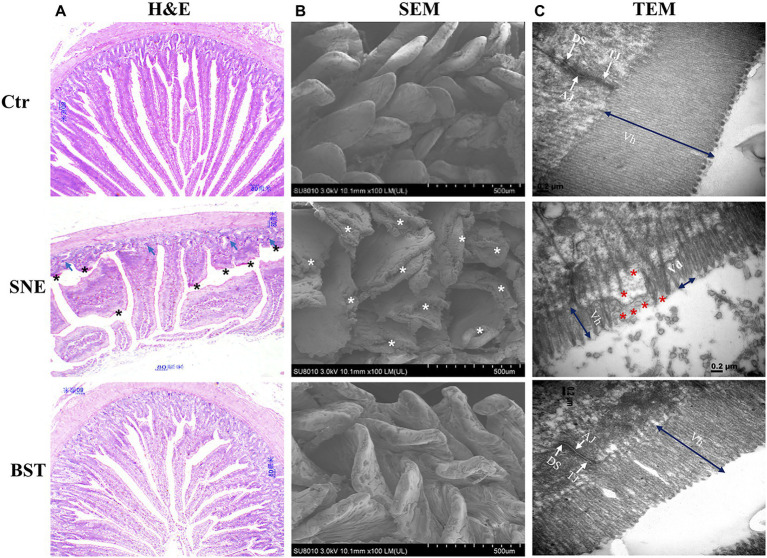
Figure 1.
(A) Representative haematoxylin and eosin (H&E)-stained images (top, scale bars=80μm); (B) Scanning electron micrograph (bottom, scale bars=500μm); and (C) Transmission electron microscopy (bottom, scale bars=0.2μm) of jejunal mucosal surface of broilers orally treated with or without coccidia and Clostridium perfringens infection. Vh, Villus height; Vd, Villus density; TJ, tight junction; AJ, adherens junction; DS, desmosomes. Shows the pathological (asterisk). Numerous enterocytes show all the features of necrotic cell death (blue arrows). Ctr group, basal diet in control group; SNE group, basal diet+SNE (20-fold dose coccidiosis vaccine)+1ml of Clostridium perfringens (2×10⁸cfu/ml coinfection); BST group, basal diet (days 1–21)+1×10⁹ colony-forming units (cfu)/kg BS diet (days 22–63)+SNE.

