Figure 5.
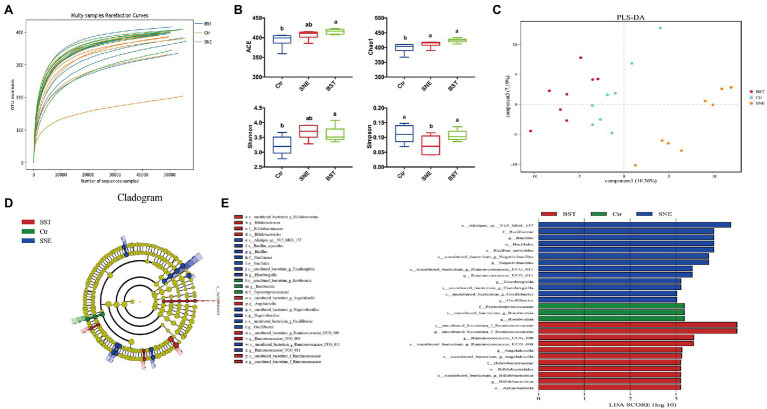
The caecal bacterial community of broilers fed with dietary Bacillus subtilis DSM 29784 supplementation among Ctr, SNE and BST treatments. (A) Rarefaction curve for total OTUs; (B) α-Diversity of gut microbial was analyzed among Ctr, SNE, and BST treatments by determination of principal dimension ACE, chao1, Shannon, and Simpson indices; (C) Partial Least Squares Discriminant Analysis of gut microbiota at the operational taxonomic unit (OTU) level; (D) Cladogram; and (E) LDA value distribution histogram. Bacterial taxa significantly differentiated among Ctr, SNE, and BST treatments identified by linear discriminant analysis coupled with effect size (LEfSe) using the default parameters. Bacterial taxa with LDA score>3 are selected as biomarker taxa (p: phylum level; c: class level; o: order level; f: family level; g: genus level). Ctr group, basal diet in control group; SNE group, basal diet+SNE (20-fold dose coccidiosis vaccine)+1ml of Clostridium perfringens (2×10⁸cfu/ml coinfection); BST group, basal diet (days 1–21)+1×10⁹ colony-forming units (cfu)/kg BS diet (days 22–63)+SNE.

