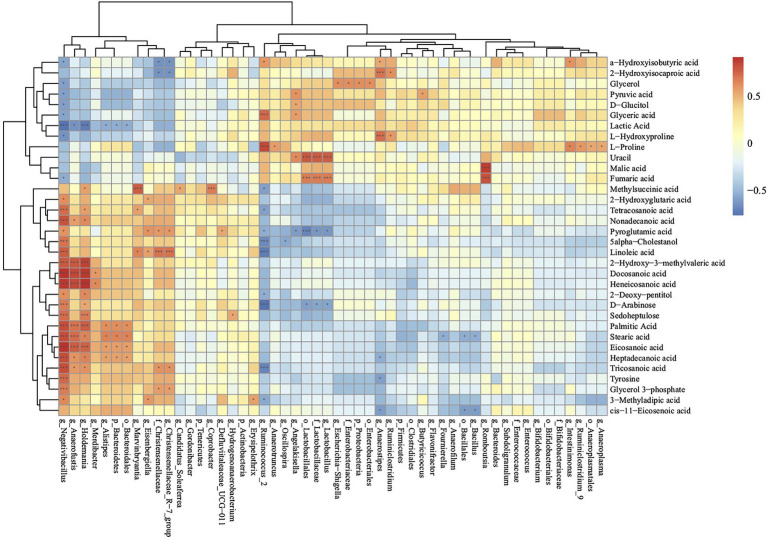
Figure 7.
Correlations of metabolome and microbiota in cecal contents according to the Spearman correlation coefficient distribution (SNE vs. BS). *p>0.01 and p<0.05; ***p<0.01. Ctr group, basal diet in control group; SNE group, basal diet + SNE (20-fold dose coccidiosis vaccine) +1ml of Clostridium perfringens (2×10⁸cfu/ml coinfection); BST group, basal diet (days 1–21)+1×10⁹ colony-forming units (cfu)/kg BS diet (days 22–63)+SNE.

