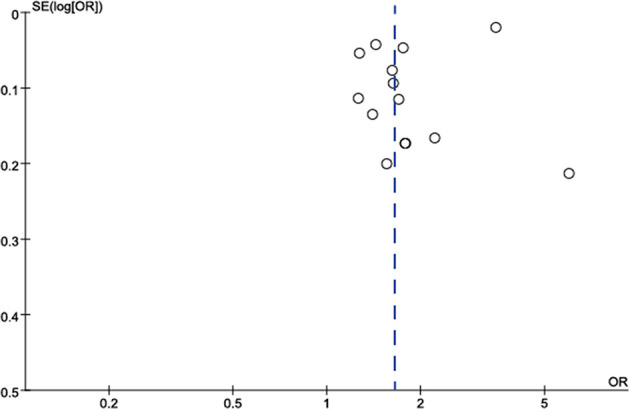
Figure 7.

Funnel plot to assess publication bias in studies on the association between TNs and the risk of MetS. Each point represents a separate study for the indicated association. Log OR, natural logarithm of OR. The vertical line represents the effect size.
