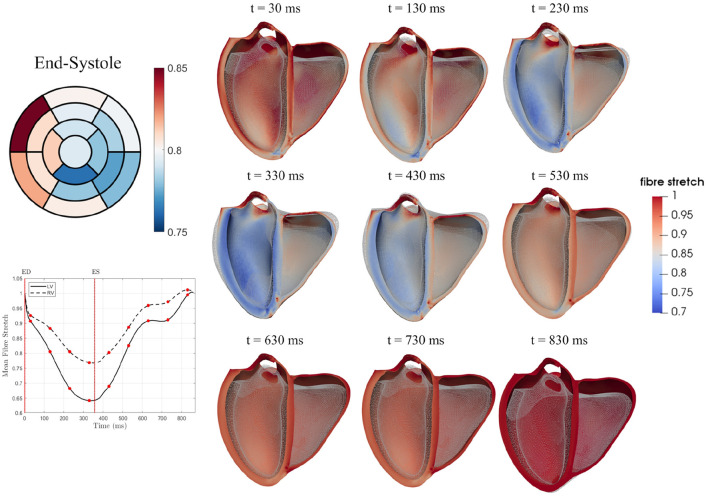
Figure 8.
Mean fibre stretch over the cardiac cycle is shown for both the LV and RV for a single case (v1). Fibre stretch over the cardiac cycle is also plotted for nine time points with the reference state model (ES) shown as a wireframe mesh. The bullseye plot illustrates differences in regional stretch at the end-systolic state in the 17 AHA regions.

