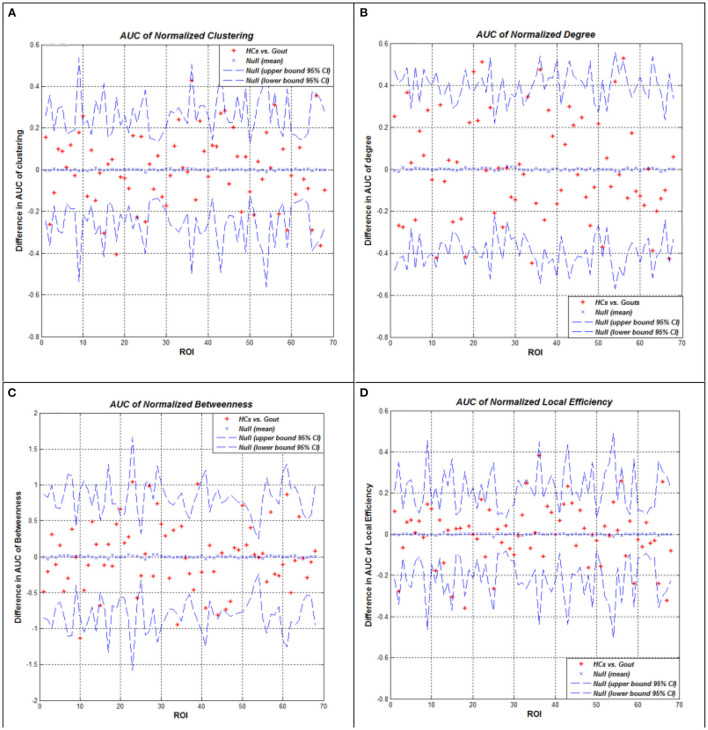
Figure 4.
Between-group differences of measures across a range of network densities: normalized clustering coefficient (A), degree (B), betweenness (C), and local efficiency (D). The red * lying outside of the confidence intervals indicates regions in which the difference between the two groups in this density is significant. All regions survived following FDR correction (p < 0.05). Gout, gout group; HCs, healthy controls; AUC, area under the curve; FDR, false discovery rate.

