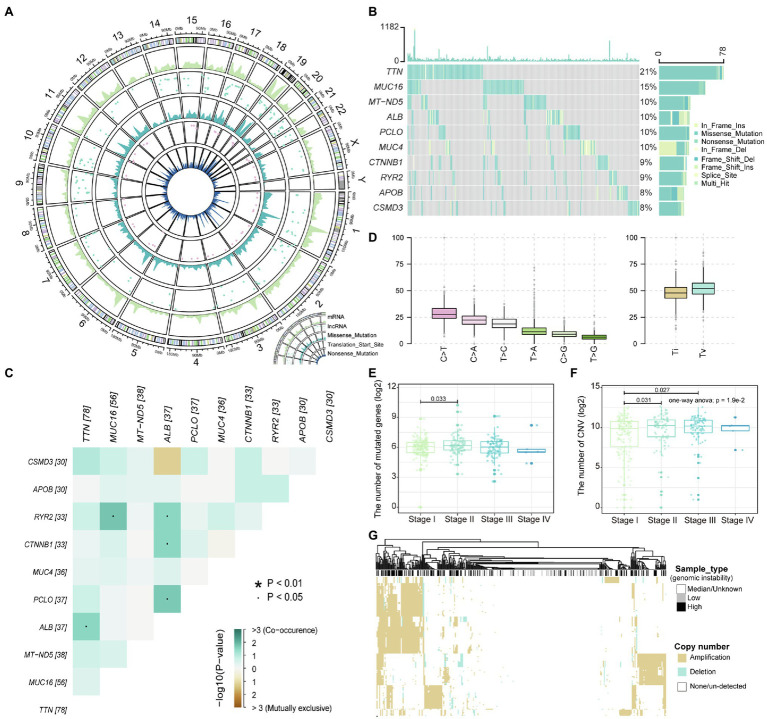
Figure 1.
The landscape of liver hepatocellular carcinoma (LIHC) somatic variations. (A) The density distribution of somatic mutations on chromosomes. The four-layer circle plot shows the density distribution of nonsense mutations, mutations of transcription start site, missense mutations, mutations of long-noncoding RNA (lncRNA), and mutations of mRNA on chromosomes from inside to outside. (B) The waterfall plot shows the top 10 genes in terms of mutation frequency by sample. The mutation type of each gene in each sample is marked. (C) Mutation correlation heatmap of the top 10 high-frequency mutated genes. Locations with significant correlations are marked by stars. (D) Boxplot shows the frequency of base substitutions including transversion and transition. (E,F) The relationship between the number of mutated and copy number variation (CNV) genes in each sample and the stage are displayed with boxplot. The number of mutated and CNV genes is logarithmized, and the rank sum test is used to assess differences between groups. (G) The copy number amplitudes of tumor samples are presented in heat map. Column labels show sample types, including high/low-genomic instability and median.

